Simple Bar Graphs with HTML and CSS Variables
I've been poking away at my student skill dashboard and the users index page really needed a facelift. I wanted to give a visual for their progress on the skills I've assessed so far in class with a little bar chart. I reached for some Python charting libraries which were super complicated, needed a bunch of dependency installs, and most required Javascript to render or to save a file on my filesystem. These progress bars change from time to time, so I wanted something more lightweight.
After fiddling for a while, I decided I didn't have the brain power and just threw a completed / total column on the table. This lists all students - current and past - which is why the totals change from row to row.
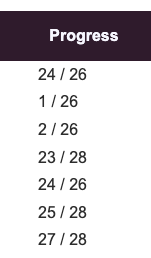
After a cup of tea, I realized that I can just use CSS custom properties to do this. We're working with grid layouts in my web development class, so that's a nice tie in for a real-world application.
First, I updated my template file. I originally wanted to use data-* attributes and then access them in the CSS with the attr() function. The problem with that method is that attr() returns a string and CSS grid needs integers. So, I went with putting an inline style with a custom property in the template that is picked up and styled individually in each row.
<div class="graph" style="--data-cols: {{ user.assessed }}>
  <span style="--data-colspan: {{ user.proficient }}></span>
</div>
.graph {
  display: grid;
  grid-template-columns: repeat(var(--data-cols), 1fr);
  height: 20px;
  background-color: var(--red);
}

.graph > span {
  grid-column: 1 / var(--data-colspan);
  background-color: var(--green);
  height: 100%;
}
This turns into:
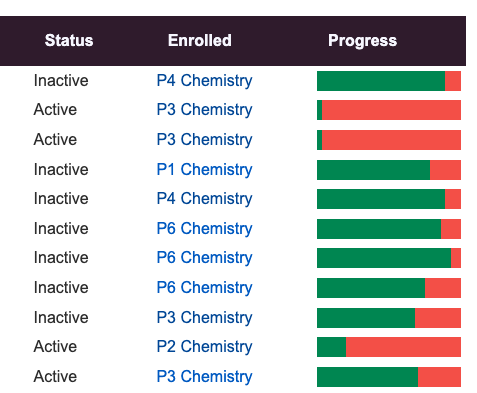
So simple and just as effective as a full on chart rendering library.

Previous
Shaming AI Comments