– Articles and websites announcing badge initiatives at K12 peaked in 2014-2015. I haven’t found many articles from the last two years.
– Many (seem to have) started with schools who had a high level of teacher buy-in for PD to begin with. Building the drive for development took place before badges were introduced.
– Most of the programs started as a way to (seemingly) expose teachers to different software and programs they can use.
– Very few of the programs required evidence of implementation along side reflection on implementation. Most implementation evidences were photos or videos of you using the app/program/thing with students.
– No site talks about benefits for completion other than being given a [adjective] digital sticker!
I’m not convinced badging/credentialing is a bust. I’m more convinced that programs that offer long-lasting value for teaching staff are elusive and take careful planning. It’s also apparent that consistent implementation through support and updated offerings is difficult. Having a staff who is able to meet the shifting needs of a district over multiple years is key. It’s also going to be important to have a very clear mechanism for evaluation of change in instruction because that’s the component that benefits students.
I have several Google Sheets doing several things on their own through Google Apps Script. I’ve started to make it a habit that each action is logged to a separate, isolated spreadsheet so I can pop in and look for error messages in one places rather than several.
This poses a small problem. I have to actually remember to open that sheet. Usually, something goes wrong, and then I remember to check the logs. I wanted to have something more up to date that I could glance at without too much effort.
You can get Google Sheet data as JSON which is handy in a number of contexts (here and here are two examples from my own work). It’s not as straightforward as tagging .json on the end of the URL (though that would be sweet) but the process isn’t hard. To get the data, this post details how to publish your sheet and find the feed.
Once the dataset was live online and updating regularly, I needed to decide how to get it. I use GeekToolon my desktop so I decided to use a Python script and the Responses library to gather and process the feed.
I put this into a Geeklet on my desktop and voila!
Give it a try with your own sheet. You can run it in your terminal to get a printout of the last 5 entries of the sheet. The JSON output from Google is really weird, so it helps to put it into a prettifier to make it more readable before parsing keys.
The DeVos DOE and Indiana education politics continue to lead the way in removing resources from public institutions to funnel them to charter programs.
Hoosier Virtual serves 1,800 students. It has been marked as a failing school on our state evaluation system for six years in a row. If this were a public institution, it would have been put under state oversight and continued to operate on an improvement plan. But, because it’s a charter program, it’s shuttering in June 2018. One of the school board members for Hoosier Virtual is a political appointee of Mike Pence to the Indiana State Board of Education.
Google Slides got a big update from Google this week, notably the inclusion of AddOns and Apps Script functionality. The UI updates are nice (grid view, skip slide, etc) but the real power and extensibility of Slides through GAS allows for connection beyond the immediate audience.
Some ideas I know I’m going to play with:
– Auto tweet images of slides through a presentation to a hashtag
– Update slides with data/charts from a spreadsheet so data is always up to date
– Auto-generate photo slideshows from a Drive folder of images
I have a Google Sheet which displays all upcoming PD in the district. It also tracks registrations for people through a web app. I’ve documented that in other places, so I want to focus on an easy method of calculating days until an event to use as a script trigger.
This started because teachers were looking for an automated email reminder a few days before the workshop so they didn’t forget to come. I’d rather they get a Calendar invitation when they register for the event, but I ran into some authentication snags, so that aspect is back burner for the time being. Currently, the sheet is using today’s date and the date of the workshop to trigger an email four days in advance.
Calculating the “days remaining” is pretty easy. The cell formula is:
– ARRAYFORMULA applies formulas to a range of cells rather than a single cell. Saves me from having to copy the formula down to each new entry.
– ISBLANK checks for data in a cell. Because it’s inside ARRAYFORMULA, it looks at the cell in the matching row. If it is blank, TRUE is returned.
– ROUNDDOWN rounds a result to a whole integer. This is useful because the subtraction taking place inside the formula returns a large decimal. This makes it easier to test in the script.
– NOW gives the date and time when the sheet is updated. Any time you make a change, NOW is calculated.
– The IF conditional keeps the sheet clean and wraps everything up. The syntax is, IF(_logical test_, _value if true_, _value if false_). So, this reads, “If the cell column B for this row is blank, show nothing. If it’s false (is not blank), calculate the difference between the PD date in column B and NOW.
The core of the function is the count down calculation. For instance, today is Friday, September 8. Subtracting it from a date in the future like Monday, September 11, returns a whole integer: 3. I can test for that integer (or any integer) in a simple script.
This is particularly helpful with timed triggers in scripts. I have a utility script wrapped in a conditional:
“`
if(date === 3) {
// do something here
}
“`
If the condition isn’t met in the script, nothing happens and I don’t get a failure email notification. This is also nice because if I want to adjust the timing, the trigger can stay the same (daily, for instance) without changing the codebase.
Outsourcing education doesn’t look like robots taking over our classes. It happens when we willingly turn over the tasks of teaching to machines without thinking through implications or repercussions thoroughly.
Computers are really good at a lot of things. Media companies are also really good at a lot of things. When the two really teamed up in the late 90’s/early 2000’s with the Internet becoming more consumer focused, there was a big shift in the way the Western world – in particular Americans – interacted with media. The move from producer to consumer started in the 50’s with television becoming more ubiquitous and speed-of-light imagery took over our visual world. Information was available instantly through the telephone, captured on film and broadcast to us in the comfort of our homes.
These films ultimately made their way into the classroom and mixed media instruction, the precursor to “edutainment,” became an expectation. With the computer revolution of the 1980’s and the shift of entertainment into all areas of life (political and social, in particular) education was soon to follow suit with educational films and games that focused on the entertainment aspect and not so much on the educational component. The teacher was starting to be outsourced because content should be now, decontextualized, and consumable in a comfortable amount of time.
The growth of EdTech in the late 2000’s has pushed this boundary even further. Teachers are no longer consumers – they’re “ambassadors,” focused on serving students with some perks on the side. Content can – and should – be outsourced because information is available in all of our pockets. Why should I, the teacher, be focused so much on the curriculum when I need to focus on the experience my students have?
Neil Postman paints the early days of edtech in Amusing Ourselves to Death. It’s stark, reading this book 21 years after its original publication. Postman devotes an entire chapter to the trend of entertainment-as-king in education and his predictions ring true.
Yes, teachers are undervalued, scapegoated, undersupported and treated poorly all around today. Our classes are large, our schools and policies can be suffocating. We lack resources, time, and frankly, pay, to accomplish impossible tasks set before us. Yet we show up every morning to continue the work. (I won’t raise teaching to the realm of nobility because that comes with it’s own set of problems.)
Outsourcing is subtle and often overlooked. We want lessons to be memorable. We want to provide the best experience possible for our students. There is nothing wrong with that goal. The problems come when the means to achieve the goal sink to places which ultimately continue the cycle of devaluation of the profession.
Highlighted recently, the frequency of product “ambassador” programs which throw perks to teachers in exchange for recommendations (and even students as guinea pigs) has grown exponentially. Companies promising to revolutionize learning are taking advantage of a cultural bias against teachers and feel like they’re providing a service.
We’d be well suited to remember that if software is free, you, and by extension, your students, are the product. The freemium model is dead and to stay open, these companies need customers. Arguing that providing a few, all-star, typically already privileged teachers with resources in exchange for “some feedback on a product” is an attempt to hide what is really happening – willing participants in corporate strategy and market gains. Why focus on perks? If the value a teacher ambassador brings is so great, pay them for their insight and time.
From Amusing Ourselves…
…We delude ourselves if we believe that most everything a teacher normally does can be replicated efficiently by a micro-computer. Perhaps some things can, but there is always the question, What is lost in the translation? The answer may even be: everything that was significant about education.
Outsourcing ourselves in the name of efficiency or engagement sells short the role of teacher. Focusing on the authentic “as-is” nature of learning is always a better option that the more efficient, computerize, compromised classroom. Recognizing that edtech companies and teachers have different goals is also important. Companies exist and function to make money. Period.
Teachers exist and function to make better people in the world.
Postman called this out in 1986. No one listened. 21 years later, are we ready to listen?
—
This post was written immediately after finished Amusing Ourselves to Death. Ihighlyrecommend picking up a copy to read.
The nuances of digital teaching and learning are often lost on Twitter and off-the-cuff blogs. Posts long enough to explore some of the finer points of teaching and learning today are often skipped over as being “too academic” or “too heady.” Nope, those posts aren’t written for teachers “in the trenches.”
I’ve moved fully into a coaching position with my district. One of my primary goals in this role is to help teachers digest and process what it means to teach effectively, equitably, and responsibly in a digital world.
We cannot separate ourselves completely from bits and bytes. The Internet has gone from being encased in phone lines to flowing in, around, and through us all day, every day. The Internet used to be hard to use. Now, it’s an expectation that it’s just there. The change in availability and usability means the user base increases exponentially while understanding of the mechanisms for use decrease.
With the explosion of online “learning media,” it seems that teaching can be boiled down to engaging videos and the right entrepreneurial mindset. The personal branding narrative of edu-Twitter and edtech in general is a byproduct of the deconstruction and dissolution of structured debate and discussion about solid pedagogical practices.
Intentionality in Instruction
Popular posts in the edu-blogosphere inevitably come back to teachers leaving the “sage on the stage” role to become a “guide on the side.” The sentiment rolls off the tongue and it makes us feel good about making connections with students. But, it lacks the nuance necessary to have any kind of significant conversation about the differences between didactic instruction and active learning.
We have set up a false narrative. I do not have to remove myself as an expert in teaching and learning in order to make connections with students or allow them to explore their interests. The guide-as-greater narrative attempts to make the case that we are partners in learning, but not without the devaluation of a profession as a whole. As a result, schools are throwing students into virtual credit programs led by a single teacher at a dashboard and equivocating it with an in-person experience down the hall.
Sherry Turkle calls this out in Reclaiming Conversation in a chapter focused on changes in education practices which have shifted as a result of prolific digital resources. She doesn’t go so far as to say that Internet-ready tools are destroying a generation but she does call for specific behaviors to change on the part of developers and users alike.
Her most poignant observation was calling out the difference between the natural, as-is instructional setting with the digital, as-if representation. When students are working in the same space – conversing and collaborating with one another, they are experiencing community and content in a real way. “The message is the medium,” as they say, and when we connect teaching and learning with very human interactions, the content gains new relevance.
As a teacher, it’s still your responsibility to construct a learning environment where context lends relevance to the content, whether it’s through constructionist work or through direct instruction. Without intentional preparation and implementation, digital or tangible, instruction suffers.
Finding the Proper Place
Andy Crouch offers insight on technology being in its proper place in his book, The Tech Wise Family. He opens with a story about blitzkrieg cleaning when his children were young. Anything out after 10 minutes was either donated or trashed. (He tells a story about dangling favorite toys over the donation bin to speed things along.) The point being that a house is out of order when things are not in their proper place.
In the classroom, we make proper place decisions about everything, it seems, except for technology. Since we have it, the edu-Twitter cultural push is to use it all the time. Need to do an assessment? There’s an app for that. Want to encourage collaboration? Use this website. Ditch your books for Google because “they’re out of date the minute they’re printed anyway.” The suggestions for technology uses for teachers starting out on this path are wholesale and without nuance and it’s hurting educators across the world.
Technology is not taught in its proper place, and that is a problem. Just like intentional instruction, technology use has to be hyper-intentional. We’re seeing this right now as we move into year one of a distributed iPad rollout in our district. The iPad (or Chromebook or Surface tablet or Linux machine) can be a powerful tool for learning but only when it is in its proper place. Students need to be taught to use the hardware as an instructional aid. Teachers need to be taught how to design units and lessons which intentionally place technology in spots where it can be used for powerful purposes. It requires a cultural shift for all parties.
For teachers, it is much more than taking a plunge into paperless classrooms, making sure they’re a part of every Twitter chat they can get in on, and starting a blog. It’s important to remember that we are training future adults – we have to keep the long game in mind. Using some gimmicks now to keep students “engaged” for the day is robbing them of a life skill which can help them function as adults. Some growth may come through chats and blogging (my own growth included those things) but not without recognizing that they aren’t required for change to happen. Instead of making flat recommendations about what people should do, we need to be approaching these conversations from our personal perspectives, telling stories of what worked – and, more importantly, what didn’t work – as we grew.
Reading and Writing for Nuance
Another component of my work is staying on top of what teachers in the district are reading and talking about. I noticed our central library had a number of copies of Ditch That Textbook by Matt Miller. I grabbed a copy so I would be able to carry on a conversation with people who have read it.
If there is a book that exemplifies a lack of nuance, it was Ditch. Much of the book can be boiled down to:
– Join Twitter.
– Use Google Apps [G Suite] religiously
– Talk about how awesome you are now that you’re on Twitter and G Suite.
Each chapter up until Section 4 – page 197 – read like a blog post pushing a thin implementation of tech for poor reasons. For example, much of the first section talked about the power of being paperless without really diving into instructional effectiveness. As I read I tried to highlight simple suggestions written as if they were the best solution to a particular problem in the margins. My intent is to go back through and try to identify instructional situations where those suggestions are relevant to give context to teachers looking for help in school.
The difference in tone between books that were all taking on the same topic is stark. Segmentation in a market (education is a market, after all, and edtech is a particularly lucrative submarket) and these books speak to their particular audience. After three months, I’m focusing on ways to bring teachers from the realm of edtech sex appeal into technology-rich instruction with fidelity to nuanced practice.
Making the Transition
I realize that some of the judgements I’m making are not fair at face value. I’m also very aware that changing practice takes a long time, especially if you’re searching for methods to change on your own without support. But, I’m not convinced that the path most teachers follow through the edtech regions is the best, or only, one.
The discrepancy between these books is stark. I don’t disagree that the more exciting changes come from trying apps and tools because they show off well. Changes in philosophy are harder to show in a Tweet and even harder to process and make essential in our day to day goings on. As a coach, it would be a disservice to not push teachers for the philosophical shift in everything I do, even through the lens of using a particular tool more effectively.
This is the spot when I would offer a handful of poignant, but not heady, methods for making the shift.
I don’t have any.
This is an intensely personal process. It requires reflection and relationships. The goal for teachers, in any case, is the same: improve teaching using resources intentionally.
Edtech preaches a wholesale shift away from the tangible in favor of the digital. Deniers push back with a deep-seeded reluctance to discuss new ideas or methods. I’m convinced that proselytizing either approach, while good for personal branding and making a name for yourself, is ineffective in the long run. Reading with a critical eye, looking for statements in absolutes and ultimatums, and thinking beyond short-term gains make the difference.
I did a Google search for “bullet journal” and I was down the rabbit hole. After a lot of reading and clicking, I agree with Robert’s initial assessment: most posts are about making your notebook look just right instead of working just right.
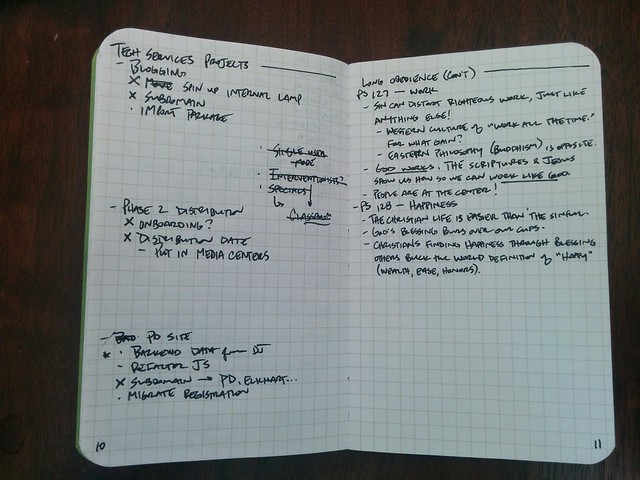
I’ve been playing with the bullet journal (you’ll see it called a bujo on most sites…I refuse to use that term) idea for a couple months and I now have a system that works really well for me.
One complaint about the journal is that it cannot possibly hold all the tasks that need to get done day to day, quickly becoming laden with redundancy and non-helpful pages. To mitigate, I use my digital todo list to manage the small tasks (which is actually one of the lessons in Getting Things Done) as a part of the larger project. The todo list helped me with the parts, the bullet journal helped me get the big picture under control.
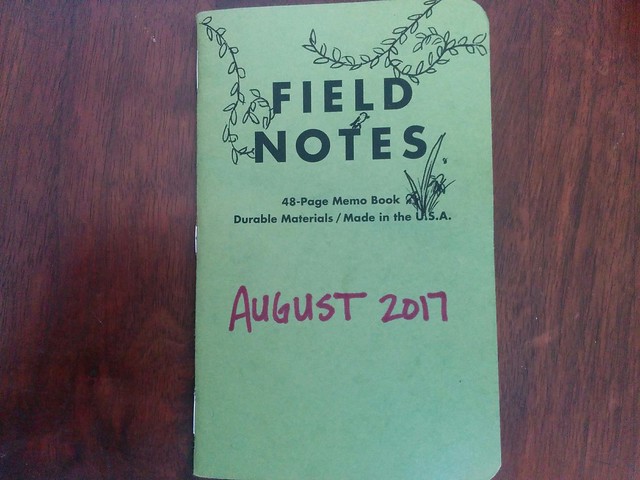
I wanted something functional, which meant I needed something small. I had some old Field Notes notebooks lying around, which fit perfectly in my back pocket. Bingo.
Each book turns out to be just right for a month’s worth of work. So, each one is labeled with the current month out the front cover. It also provides a nice doodle space during meetings.
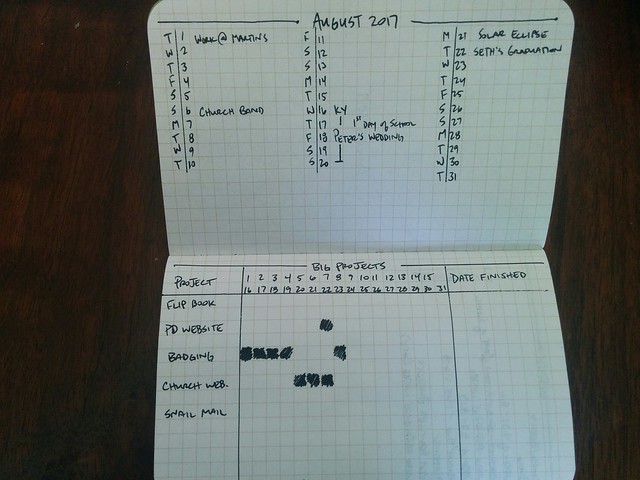
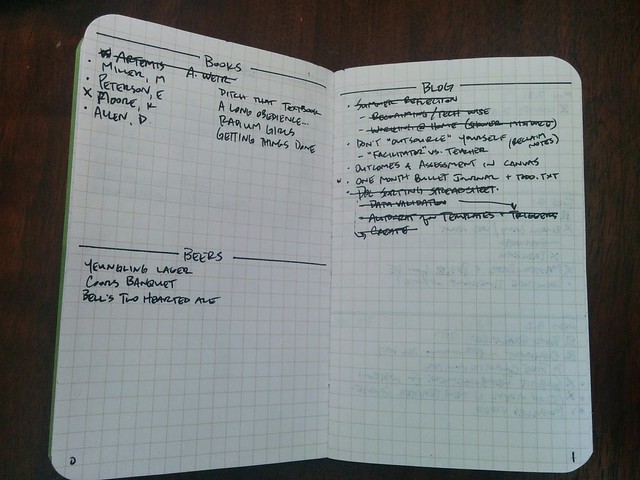
Inside, I break up the first few pages into the month’s calendar and large project logging. After the index, I keep a couple pages for books I read that month, beers I drink, and blog posts to write. There may or may not be a correlation between the number of items on each list at the end of each month. Research is ongoing.
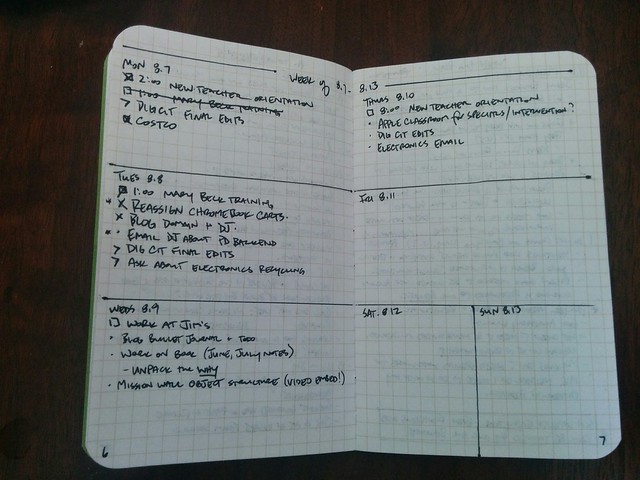
My week setup is new to my workflow. Taking a spread and breaking it down into day to day helped me get my mind in order. Large project milestones and appointments tend to take up this space. I’ll take the project milestones and add them to my todo.txt file for completion as I move through the week.
The thing I do like about the bullet journal system is that you always have blank pages later in the book. I don’t have to cram everything in between pre-printed week layouts. It’s flexible and it works well for me, especially because my role is expanding this year, with lots of moving parts on a number of projects.
I’m in my third full month of the combination bullet journal/todo.txt list and I haven’t dropped many balls yet, which is good. I feel more prepared day to day, laying out obligations and needs on paper and then adjusting small tasks to make sure those get done.
No frills, no tweeting my immaculate page layouts, no discussion over what type of pen I use. Just a good, efficient, simple system to get stuff done.
The edu-blogification of ideas gets overwhelming. Six years ago, I went to a workshop on using videos to help with my instruction. We called it the flipped classroom and it helped me work more effectively with my students. I learned about my own strengths and weaknesses (watching your videos day after day is a great opportunity for reflection) and I had the fortune of being pushed by some great friends to think deeper about instruction.
A couple years later, many of us felt like “flipped classroom” wasn’t descriptive enough. Words mattered and suggesting that the classroom space alone is what changes wasn’t accurate. So, we started saying “flipped learning.” We even got together one weekend and wrote up what we called the four “pillars” of flipped learning.
For me, the biggest piece comes from Ramsey Musallam, who says that flipping, at its core, is distinguishing between the “community” space and the “individual” space. What happens in community traditionally is lecture – whole group instruction. Move that to the individual space in whatever way you’d like and you’ve essentially flipped.
The pillars also make no specific mention of when or how you do this to be considered “flipped.” I tend to move my instruction to video so students can watch it if (or when) they’re ready. This might be a week early, it could be a month later. I don’t really care how, when, (or even if) they watch my video. The video is simply a step they can take at one point or another to work from.
Distinguishing between an “in-flip” or “out-flip”, a “homework” flip or a “nowayhomework” flip (or any other naming convention slapped onto the idea) begins to wall off possible points of collaboration and growth because camps have been set up. Lots of posts outlining the core tenants of being an “in-flipper” vs an “out-flipper” discourages discussion because it focuses on a single implementation in a single classroom with one particular set of students.
When we wrote the pillars, we worked to be specifically non-specific. Indicators can help define what happens the majority of the time and it can provide common ground for discussion or debate. Specializing criterion – often to stamp a brand on it – doesn’t help the broader community grow. Look for ways to describe a method or structure without coining a new label, as innocuous as it may seem, because of the danger of isolating ideas.
Keeping a todo list has always been a struggle for me. I have a notebook, I have some stuff in Google Keep, I’ve tried Google Tasks, Any.do, Remember the Milk, and Wunderlist. I’ve tried apps with goal setting, apps with reminders, and apps with synced web and phone apps.
My main problem is that it’s just another window to have open at any given point. I run a minimal desktop and dock – I don’t like windows all over the place with a dock that needs two monitors to show everything.
I work in code and the command line a lot. I usually have the Mac Terminal open along with Atom. I hop between projects and use key commands because it’s faster than moving my hands to and from the trackpad. Todo.txt is a command-line script which manages a text file called (wait for it) todo.txt. It also has a done.txt file to hold things that are finished.
I won’t go into the syntax here, but essentially, each item has a priority, a title, and a tag or two. Putting one task per line in the text file creates one new entry on your list.
The command line just makes it faster to work with because it gives built-in commands, much like the Git architecture, to create, edit, or mark tasks as done. For example, using todo add “(A) filter schools by content areas +curriculum” creates an item in the text file. Opening the file shows a single line. But, using the command line, it shows a sorted list of items based on priority.
Marking items is easy, too. Put an “x” in front of the task and – hey presto! – it’s marked as finished. Using the command line, todo do and the item number marks it as done and moves it to your done.txt file.
Putting the notes in your Dropbox is tiny and updates instantly. Any computer I use is synced to Dropbox, hence my list is synced. Pull up the Terminal, and I’m ready to go.
Getting rid of window clutter even more, GeekTool takes scripts (called “geeklets”) and lays them on your desktop in modules you customize. You can set the refresh rate as well as define groups of geeklets for different setups. For instance, I have a geeklet set to use when I’m on my laptop and one for when I’m hooked to an external monitor.
Part of my GeekTool setup is displaying my task list right on my desktop. Having a color coded list right there, all the time, is really helpful. And I’m not promoting an unhealthy work/life ratio because I can turn the geeklet off whenever I want (namely, on the weekend).
In the end, I’m really happy with this system because I control it. The setup isn’t as easy as downloading an app, but I know where my data is and I know how it’s being used. It’s a little thing, but some of the best things in life are the little things.
—
All images in the post are mine. There are a lot of great tutorials online for todo.txt as well as GeekTool.
In what’s become a half-tradition, some unfiltered thoughts as I finish another school year.
– Splitting time between teaching and instructional coaching is really, really difficult. It’s hard to pour into both equally. Next year, I’m going to be coaching 100% of the time.
– I still need to work on alternative assessment and measurement methods. Using Canvas has helped me implement SBG more effectively this year, but I still need to make improvements, especially giving feedback.
– I tend to close in on myself when working with other teachers. I need to focus on opening up and encouraging reflective dialog about effective instructional strategies.
– As I work with curriculum development and implementation teams, I need to bone up on my frameworks.
– I’m not teaching a class next year, which feels very strange…again.
There is a ton of change happening in the district and the implementation of the growth plan is wide open. My team continues to set high goals to make sure we’re constantly pushing the bar. It takes a lot of energy and effort, but the growth this year has been astronomical. Maintaining momentum and implementing new support structures in the fall is the big challenge ahead.
In November 2015, an independent model showed YouTube received around 500 hours of video content uploaded every minute. There are 1440 minutes in a day, meaning there was roughly 720,000 hours of video every day.
That’s a lot of videos.
Granted, many are of cats, kids, and Barbie Jeep Racing, so it’s not necessarily quality content uploading, but there is a lot of great video available for flipping if you’re not quite ready to make your own yet.
Where to start?
Before looking at how to choose videos, let’s define the goals of using video as an instructional tool (not method) in the first place. Don’t ask yourself, “How do I get rid of lecture?” because it’s too narrow a focus. The intent of using video should be to create space for students to explore ideas with the support of a teacher. Ramsey Musallam says it well: “Good teaching, regardless of discipline, should always limit passive transfer of knowledge in class, and promote learning environments built on the tenants of inquiry, collaboration and critical thinking.”
Flipping can help accomplish the goals of increasing student interaction with material and using existing videos is an easy way to start that process. When it comes to choosing videos to use with students, I focus on three main things:
What value does a video bring?
How well is the idea presented?
How will the video expand on what is happening in class?
Using videos should supplement, not replace your work in the classroom. Your students have a relationship with you, not a video personality. It is important that you frame using outside content as a supporting factor in the interactive and collaborative work happening in the classroom. Otherwise, you run the risk of losing student trust because it appears that you’re taking the easy way out.
What value does a video bring?
There are situations when a video can help you immediately reclaim some time. Algorithmic processes – solving a problem, correcting grammatical mistakes, putting together a timeline of events – are great starting points. They’re usually short and to the point and they become a self-help library for students. When you’re in the middle of a larger activity, these can be a “first line of defense” when students ask procedural questions. At the same time, you can pay attention to which videos you’re referring to the most and address those in class as a whole.
The value here is that you’re not bogged down answering the same, small question over and over. You’re also not obligated to stop the entire activity. You’ll be teaching students self-reliance by curating helpful instructional videos to get the habit started. Eventually, students will go off and find their own help when they need it.
From another angle, resources are limited. I can’t always provide concrete examples in the classroom. Using videos to bring in those topics and examples is a great way to bridge the gap.
How well is it presented?
Presentation isn’t everything, but it’s important. As you’re vetting content, pay attention to the content, obviously, but also make sure it isn’t mind-numbing to watch. Audio is very important in this case. A video that is clear as crystal but sounds like a drive-through is just as bad as a video you can’t see. Don’t pick the first result in the search, either. Take some time to find a video that fits your need and won’t cause more confusion for you later.
How will it expand on what is happening in class?
Remember, you are the teacher and you set the tone of the course with your students. Any video you choose – instructional or exploratory – should fit in with your day to day work. Be explicit and specific about why you’re assigning a particular video to help students see the big picture. Without making connections for the students, you run the risk of looking lazy and the videos become another assignment, not a helpful tool.
Additionally, if you can’t make a solid connection to the learning process, perhaps a video isn’t the best means. It’s a good self-check to make sure you’re proving engaging and meaningful assignments at all levels of the learning cycle.
Big picture
Online video is here to stay. The amount of content available is staggering both in scale and in potential to positively impact learning behaviors. In the end, starting with existing video can help lay a foundation for using video as a learning tool. The major time commitment on your end is starting to curate those materials. Most video sites have playlists that you can create and customize, so start saving videos you like to build out that library.
You may find, though, that you can’t find one that really hits the issue you’re having. Don’t be afraid to make your own. I’ll repeat: you have the relationship with your students. Making a short video is easier than ever and you can find a number of tutorials online to help you get started.
Focus on enhancing the class time. Use the questions above to guide your thinking as you look for materials. If you’re not sure where to start, here are some of my favorites:
I posted an update this evening which will retain the formatting of your footnotes. So, if you have text formatting (bold, underline, etc) or links, those are still there when the Endnotes are added.
You can grab the Addon from the Docs Addon menu. You can also take a look at the source (or contribute!) and test it out on a single document on GitHub.
The New York Times profiled Google’s rush into education over the last eight years in a long piece this weekend. Some initial thoughts:
– The value behind the “Innovative Educator” title is completely created by Google. There is no value other than the fact that a company says it has value.
– Skills in a platform – even a cloud platform – are important, but not removed from the content students are supposed to be learning.
– If you don’t pay for it, you are the product being sold. Even if advertising isn’t targeted to students in GSuite, when you roll that data into a consumer account, it’s all there, ripe for auction.
– The marketization of education is pervasive and can erode the purpose of education: the holistic growth of students in all areas. Allowing companies like Google (among others) to direct what “good education” looks like is dangerous.
be careful what you buy into. Everything Google has done over the last decade in education is not altruistic. There is a company mission which drives all decisions and being aware of how those impact users is important.
Our district is distributing 13,000 iPads in the next 24 months. We have ~1,300 staff who need to be trained on instructional methods with technology in addition to functional training on a new platform, using GSuite effectively and building a course in Canvas.
Training has been touchpoint number one for our team. We’re not in a culture where it’s normal – or expected – for you to go research and try something before requesting in-person help. Before this year, there was no in-person help. When I started this role in July, we were starting from ground zero. To handle how-to requests, we started a YouTube channel and a simple ticketing system. On Mondays, we host some simple how-to training workshops to get functional basics down. Otherwise, all of our training has focused on instructional changes in the classroom.
The hardest thing about building a culture of exploration and self-driven growth is the temptation to just fall back on what would alleviate people’s stress, but not actually solve the problem. Designing an effective workshop is much more than answering the questions asked. We’re constantly evaluating ways in which we ask teachers to engage with the principles of instruction we’re modeling without falling into the trap of giving lesson templates to be repeated throughout the district.
It’s difficult to model a lesson completely void of content. In fact, I think it would be bad practice to do so because ignoring content for the sake of context is a disservice to students. Content is important. But, in this case, it needs to be the backdrop. The lesson we’re modeling may be based on science, but we want to pull out the instructional practices that can be applied anywhere, not just in the immediate context. We use “metacognitive moments” embedded at strategic points in the task which ask teachers to identify what would work in their situation.
Prompts that force teachers to abstract to the lesson, not go through a lesson
Stemming from moving beyond content, my content expertise is in high school science. We focus on helping teachers apply the methods we’re modeling to their classroom using their expertise. I cannot tell an elementary english teacher to model the lesson in exactly the way I did. But, I can ask probing questions and push that teacher to reflect on what the principles of the lesson are, where they’re already utilizing those ideas, and where they could implement more.
Avoid key phrases like “compare and contrast”
Trigger phrases can immediately drop the level of discussion. Compare and contrast is especially egregious because people – teachers and students – fall back to a two-circle Venn diagram to complete the task without analyzing the problem. Action verbs are important…we do want people to compare and contrast, but we avoid the trigger attached to the status quo.
Encourage big thinking
When you’ve never had training on changing practice, you don’t know how to think big. Or, you don’t feel empowered to take the risks. Our workshops are often the first time a teacher has been encouraged to express agency and implement the big ideas. We regularly get emails weeks after a workshop where a teacher has taken something they’d learned and implemented it successfully. Excitement is palpable and it pushes them to continue to try new things.
Repurpose existing tools for new uses
“Hacking” education is all the rage right now, but the term comes with baggage. I don’t want teachers to feel like they need to be “hip” or a “rockstar” to change practice. We ask them to repurpose something – a tool they use regularly – to accomplish a new task. danah boyd talks about using Wikipedia article discussions to teach lessons about history, culture, and context in her book, It’s Complicated (jump to page 190 for the example). The idea is simple in merit but difficult to implement, especially if you’re not used to thinking beyond the immediate function.
I’ve wanted to try the Desmos activity builder for a long time, so I finally did. We were finishing up the nervous system, so I grabbed a graph of an action potential and went for it. Here’s a live student link if you want to give it a try.
I set up a few slides with an image of an action potential superimposed on a graph. I then asked students to identify different regions on the graph using the activity input tools.
The really powerful moment came when I revealed their work superimposed on the question. individually, it was easy to see in the dashboard that most people had the right shape.
Superimposed, we could really dive into the differences between the sketches.
At the AP level, we focused on the scales and how it lines up with the chemical concentration in the cells. I’m also glad I had this question first because it immediately helped me target students who were struggling more than others.
From there, I used the same graph but superimposed a horizontal line and asked students to mark the rest state voltage as well as the threshold voltage. Again, the superimposed image gave students a lot to think about.
—
As a lesson, I’m happy with how it went. Students were able to self-assess and gain insight from seeing multiple, simultaneous responses. I’m thinking hard about how to break the content barrier and get teachers to look at it’s utility for feedback and metacognition.
As a teacher, what could I have done better? What would you have done differently? Can you help me get a true graph of the action potential (ahem…please?).
(Both screenshots are mine, names are anonymized).
Comments
Lia Wahl
I am interested in the Desmos activity you talk about here, but after trying the live student link, I see it is expired. Would you be willing to share the original activity with me? It looks like a great use of Desmos in a science setting!
I’d be curious to see how you’d modify it for your class if you’re inclined to share back.
Lia Wahl
Brian,
Thanks, I really appreciate it! I am actually a math teacher teaching a PD session to the science department about the Activity Builder, so I was looking for some examples of activities science teachers had already tested out in their classrooms to use as examples. In the workshop, I was hoping to explore a few different possibilities for using the graphing features of Activity Builder, and this is an awesome example of the possibilities available.
Some initial, mostly unfiltered thoughts on digital badges from a professional development perspective:
Most badging programs are too simple. They focus on rote skill and don't have a clear pathway for building competency on a holistic level.
Buy in, like any other initiative, is extremely important. Badging isn't enticing on it's own. And being enticing for the sake of being enticing, is a really bad reason to tackle a large project.
In designing a meaningful program, outlining desired outcomes needs to happen before competencies are even discussed. Aligning tasks and work for the participants will only happen if you know what you want them to get out of the program.
Credentialing has to have weight behind it. This comes either from the organization or the privileges and benefits that come from earning the credential. This can be at the department level certainly, but becomes more meaningful if the institution shifts to recognize micro-credentials.
Displaying the credential needs to be simple.
—
I'm not entirely sure where this is going to go, but there it is.
School data can now be used by the service provider to gather student information without notification and used for whatever they want.
—
We are not immune.
If your school gets eRate funding, you are now likely to be in breach of data security rules because the ISP itself – not the app or website you’re using – is collecting and can, potentially, make money off of student information. Moreso, the FCC is in charge of eRate and Ajit Pai, the Republican chair, has promised to roll back net neutrality and privacy rules set in place by the former chair, Tom Wheeler.
This is a big deal.
I was calling my representatives to ask that they vote against this rule. Now, I’m calling to ask them to think about the monetization that is going to occur through our student’s use of the web and how they plan on mitigating the legal issues now in play just because a school offers Internet access.
This is a big deal.
Call your representatives. Stand up for reasonable restrictions on data collection and use by service providers.
If you’re working in instructional support (#edtech, instructional tech, learning support…whatever you want to call it) you’ve probably heard, “Today’s students just learn differently.”
No they don’t.
Writers will write. Storytellers will tell stories. Musicians will make music. Athletes will compete.
People have drives to be creative, curious, playful, impactful, relevant…
What’s different is the fact that school rams them through a system which actively works to standardize as much of the process as possible. We’ve built a system which prevents students from using the outlets available to show off their learning. By default, the system eliminates creative, playful, impactful work.
What I’m finding is that teachers, when shown methods and tools that give students opportunities to be creative, are surprised at how learning changes. As they struggle to characterize what’s happening, the easiest explanation is that today’s students are just “different.”
We fail to recognize that it doesn’t take a computer to allow students to engage. My job is to help teachers figure out how to get out of the way. The challenge is to make sure that teachers see instructional benefit in shifting practice with – or without – the technology in the classroom.


I am interested in the Desmos activity you talk about here, but after trying the live student link, I see it is expired. Would you be willing to share the original activity with me? It looks like a great use of Desmos in a science setting!
Thank you in advance!
Hi Lia,
Here's the teacher link you can use.
I’d be curious to see how you’d modify it for your class if you’re inclined to share back.
Brian,
Thanks, I really appreciate it! I am actually a math teacher teaching a PD session to the science department about the Activity Builder, so I was looking for some examples of activities science teachers had already tested out in their classrooms to use as examples. In the workshop, I was hoping to explore a few different possibilities for using the graphing features of Activity Builder, and this is an awesome example of the possibilities available.
Thank you!