Posts
Teaching is being overrun by impostors. Perhaps I’m reading into something, but the explosion of “Teach Like a [thing]” culture scares me. Culturally, have we reached a place in education where taking on a persona to find inspiration for change is the best option for our students? Simile is powerful and inspiration comes in many forms. But when inspiration turns into identity, it becomes a problem.
A lot of the personas invoked in these discussions are really awful role models. Working renegade, above the mire of educational bureaucracy, might set you apart on facebook or Twitter, but institutional change – powerful change for all students – rarely comes from one person doing their own thing in isolation.
How do these ideas spread? How do we move beyond the 150 “best” ideas for X, Y, and Z? Where does the inspiration really make lasting impact on our practice and not just the toolset?

Growth flickr photo by rubberkid shared under a Creative Commons (BY-NC-ND) license
Finding excellence in teaching means recognizing teachers at their best: real interaction with real students. My students don’t want a viking, a ninja, a champion, or a wizard. They want a teacher who is genuine.
Let these ideas serve as inspiration, but remember that real change in learning comes from teaching like a Teacher.
I wanted to use a new method of reviewing with students as we wrap up our cell activity unit. I’ve been working with my students on forming questions with the question formulation strategy around content as well as finding new ways to build content knowledge resources. We’re at the point in the year where details are more and more significant and we connect (seemingly) disconnected ideas.
I threw together a template spreadsheet (click to make a copy for yourself) in Drive and then assigned students to groups. Using Doctopus (life changing…really), I was able to give each group a blank template. Their task was to come up with review questions on anything they’d like from this section.
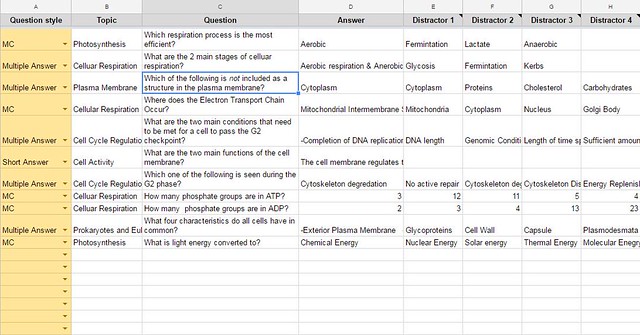
Review questions in Sheets flickr photo by bennettscience shared under a Creative Commons (BY) license
The next layer was to have the groups look at their original questions and revamp them into something that is AP Biology-worthy. Groups that do this well will have their questions included on the test.
I noticed three things:
- Critical review by individual students. The questions they asked me underscored misconceptions present. I was able to work them through why the right answer was right and where they needed to correct their understanding.
- Competition amongst groups to ask better questions was high. I didn’t promise only one question included, so there is a high desire to write really good questions. Group members worked together to revise and strengthen their questions.
- Writing questions that really check for understanding is difficult. It’s easy to write a really hard questions. It’s much more difficult to write a question that checks for understanding. Students recognize that the questions I design and ask are very specific for a reason. They’re going through the same process.
In the future, I would build some kind of dashboard to aggregate the questions and look them over as a class, but with time short, I think this is a good first pass.
How would you build or extend this? What am I missing?
I’m proud of the work I do every day, both in my classroom and in the small instructional team I work with. There’s nothing wrong with being proud of work, but there’s a world of hurt if pride creeps its way into your team dynamic.
Being prideful serves only one person – you. It will alienate you from relationships, especially when there is shared work to finish. Revision is consistent and this is where, in my experience, pride often comes to a head.
Consider this situation: You and a team are working on a shared document. Your role, just because of time, has turned into synthesizing the bulk of the notes and outlines into the narrative of the piece. You write and re-write multiple times until you’re happy with the finished product. You’re proud of the work and you send it off for approval.
Your team leader comes and reads and makes a number of changes to the document. This is the telling moment: do you discuss and work with their perspective? Or do you let pride well up in your throat and you choke back frustration?
If you choose the latter, from now on, you’re going to carry that hurt. Any work environment, especially a collaborative setting, has to allow for safe and constructive feedback. Changes to a final product improve the performance of the team and not any one team member. Pride tells you to push for your own recognition. Humility tells you to work for the good of others. Powerful, effective teams work for the benefit of their members.

Building this culture in the classroom takes a long time and it takes the guidance of an experienced teacher. These are not normal behaviors for adults, let alone students. This is one argument against assigning random or variable groups in class. Building a cohesive, service-based culture with peers requires consistency. On the other hand, if every student can develop this mindset, then the specifics of a group become less of an issue as each individual is already committed to working for the good of the whole.
This is a cross post from my photo-a-day(ish) blog, the photoyear.
—

Kinsman soap flickr photo by bennettscience shared under a Creative Commons (BY) license
My family has a heart for the refugee crisis. We’ve researched how we can help Syrians, in particular, fleeing civil war find their way to the United States. Unfortunately, Indiana has some of the most restrictive regulations in place in terms of bringing in or facilitating the arrival of refugees.
Kinsman soap is run by the Preemptive Love Coalition as a way to support refugees who cannot make it somewhere safer. We received gifts of soap made by men and women who haven’t been home in years. This is our small way of helping from a distance.
If you’d like to know more about the organization, check out their website at www.preemptivelove.org/kinsman.
One of the main responsibilities my team has is offering and running training on a number of resources teachers in the district have access to. The most popular, because of their new-ness, are Google Apps (GSuite…whatever) and Canvas. Because we offer so many workshops, our Drive is full of copies of copies of copies of registration forms. So, I built a custom registration form using Google Apps Script and a Sheet. This detail-heavy post walks through the entire process with code.
The End Product
There were a lot of iterations of the project and in the end, we wound up with a website which:
– Can be managed by anyone on the team
– Collects the username (their email address, actually)
– Displays available seats for the workshop
– Allows users to both register and cancel registrations
– Displays the user’s current registrations
The Back End
This uses a Google Apps Script web app and a Spreadsheet to run the back end service. The sheet serves as two databases: course offerings (with details) and user registrations. The front end site uses AJAX calls to populate a page specific to the user.
In order to return the correct data, Session.getEffectiveUser().getEmail() is used to check the logged-in user against the database so only their course information is returned. For example, this script gets the current user registrations from the registration sheet:
Much of the backend work is building arrays and objects of the correct data and sending it to the client side scripts to display. The full commented code is in this GitHub Gist.
The Front End
Google Apps Script allows for templated HTML. I’m not using a template, per se, because it’s loading a static page and populating div elements with AJAX calls. But, the same could be done to create multiple pages using the same template.
There are two main actions: registering for a course and cancelling a course. Both call the server to make changes to the spreadsheet and pass updated information to the front. Registering for a course (or courses) write across a range rather than submitting n number of results for that user. Cancelling a course, instead of building and writing a new array, searches through the Sheet for the user and the matching date and simply deletes the cell. The app is then reloaded to refresh the user registrations at the top.
It’s not pretty and there are some changes I still want to make to clean up some of the array building/passing, but it’s such a small amount of data, the site loads very quickly even with a large number of registrations.
If you have suggestions, or if you make improvements, please leave a note in the comments. As is, you could probably copy and paste most of this into your own sheet and get it going. Be sure to fill in the correct sheet names and ID’s in the code.gs file to avoid breakage.
—
Networks flickr photo by eflon shared under a Creative Commons (BY) license
When I try new things, the fear really sets in as I’m giving instructions and trying to pick up on the nonverbal cues my students are sending me. Most days, they roll with it. Other days…well, there is usually some kind of course correction in there.
But it’s part of my practice now. Not crashing and burning of course; I learn a lot on those days, but I try not to make them the norm. My practice is to constantly as, “Can this be better?” Sometimes, the answer is “No, not right now,” and that’s totally okay. Other times, I’m actively trying to improve on a lesson, a task, or a supporting item.
Flipping is easy to jump into. Need to teach something? Find a video. Slap an EdPuzzle quiz on there and post it through Google Classroom. Students, turn in a one page summary of what you watched. Quiz on Friday.
Don’t keep your practice the same and call it flipped.

flickr photo shared by Daniel Kulinski under a Creative Commons ( BY-NC-SA ) license
How are students engaging with the ideas? Not engaging with the video, but with the idea? The intangible? The abstract? The metaphorical? How are your students processing what you need them to learn in meaningful ways?
Flipping is really about a core change in practice that forces you, the teacher, to recognize that effective, deep learning requires our students chew on ideas…and not just gnaw, but really chew hard. Video might be a component of the chewing, but it can’t be the beginning and the end.
How do we avoid falling into a trap of simply adding another task to check off the list in the learning cycle? I have three main self-checks:
- Keep the video _thin_. This is the first exposure, not the only (or even main) exposure. Some questions should be answered, but I really want to get students asking more questions. I try to ride the line of thorough instruction and full instruction.
- Explicitly connect ideas from the video to class. I do this in a number of ways from a quick five-minute warm up at the start of class (“Remember, in the video…”) or in the video itself as a preview (“We’re going to do a lab where…”). I’ve found that these peeks help students make connections more readily as the learning tasks come around.
- Tell them the videos aren’t enough to get by on. I don’t remember when this hit me, but I never really said that the video alone isn’t enough to help them learn. I make sure it’s very, very clear that they need to engage with me – and each other – during class to really excel. Video is a tool, not the solution.
In the long run, by downplaying the magic-ness of your videos and underlining the importance of multiple modes of engagement, your practice will begin to change. You’ll use that reclaimed time more effectively and you’ll find yourself starting to look critically at everything you do.
I use darktable to edit my photos. It’s a really robust RAW photo editor with a very active development community. The GitHub repo has 19,000+ commits on it over the last five or six years, which is great because it means active improvements. Open source FTW.
It’s built mainly for Linux, but somewhere, someone added an OSX installer. I edit my photos and then used the Flickr export option to dump them right up to my albums. Over a year ago, I got a really weird error about an invalid “frob” that prevented authenticating.
After digging…a lot…the problem started in 2014 when Flickr required HTTPS calls to the API. Tonight, I figured out how to patch the broken library in the app so I can upload to Flickr again from darktable. Hurray.
To fix, you’ll need to grab the latest version of the flickcurl library. The one packaged with the app is out of date, using HTTP requests rather than HTTPS requests. I used Homebrew to grab a copy (brew install flickcurl) but you can also download a zip file and install that way.
All apps on Mac have files you can explore. I worked in the command line because it was faster for me than opening a couple Finder windows, but you could do it that way, too.
Terminal command
cp Your/File/Location/libflickcurl.0.dylib /Applications/darktable.app/Contents/Resources/lib
Finder window
- Open a finder window with your downloaded library. Then, open a second Finder window and go to Applications. Right click on libflickcurl.0.dylib and click Copy.
- Right click on Darktable and choose “Show package contents”

Screenshot is mine.
- Go to Contents > Resources > lib
- Right click in the folder and select Paste (or Cmd + V) and then click Replace.
The next time darktable opens, you’ll use the updated flickcurl library and be able to share directly from the app itself.
Pictures launch stories. I take a lot of photos and like most people, they stay on my phone. I used to use Instagram, but I’m not happy with their terms or use limitations on photos (ever tried to embed an image? It’s a nightmare). Maybe I’m an idealist and this is a funk, but whatever.
I’m posting to Flickr more and more regularly and I decided to make a small project for 2017. I’m going to tag a photo each day that will push it and the description over to a new blog I’m calling The Photoyear. It’ll syndicate that photo (technical stuff below) and turn it into a blog post. You can subscribe via RSS over there if you’d like. Sometimes, I’ll cross post it here, but that will be a place for pictures and their stories for the next year.
Thanks, as always, for reading.
Setting up Flickr syndication
I started by writing more descriptive…descriptions…with my photos. That led to the idea of running a blog entirely on photos – content and all. Since I’m already doing that on Flickr, it made sense to try and syndicate it back to a blog of some kind. Alan Levine is the king of all things RSS. Some of his posts led to working solutions.
Recently, Alan posted where to find the Flickr RSS feed for public photos. Instead of grabbing everything I post (often more than one photo per day) I wanted to grab just one. I was going to manage that by adding photos to an album, but you can’t do that anymore (not with an RSS URL, anyways). Sad trombone. So, I stick to tags.
I fired up a subdomain – photoyear.ohheybrian.com and installed WordPress and the FeedWordPress plugin to syndicate posts from any RSS feed. Running out of the box, it grabs the tag only from the XML:
The immediate problem is the size of the embedded image. The src attribute is https://farm1.staticflickr.com/543/31231759933_ba613deec1_m.jpg, meaning the medium sized image is embedded, which is tiny. I had to get brave and check out a PHP solution.
In functions.php, I added a new filter (thanks to the suggestion of…you guessed it…Alan) which simply changes the _m.jpg to _b.jpg for a nice, full-width image.
I’m still not totally happy with my PHP solution because each post is going to come with, “a new photo by bennettscience” appended at the top. I tried using a preg_replace function to find the string and remove it (it’s always the same), but I didn’t have any luck. If you have a suggestion, I’d love some help figuring that snippet out.
Anyways, all said and done, you can check out The Photoyear now and then to see what’s up. I’m looking forward to reading back over everything as we move through 2017.
A year ago, I posted a script which converts footnotes in a Google Doc into endnotes. I’ve gotten great comments and feedback and have made the standalone script better, which is still available.
The Endnote Generator Add-On is now available in the Chrome Web Store for Docs. Install it once and you’ll be able to create endnotes from the footnotes you’ve already inserted in your doc.
There are a couple of known issues (pictures with a footnote aren’t included yet), but if you run into anything, leave a note here or on GitHub.
Check out the Endnote Generator.
I do some (really) amateur web development when I get a chance to. I enjoy building things that make life easier for me, and others, using the Internet to drive the functionality. I’ve also been working more and more on a Chromebook just because it’s easier to carry around than my 15″ Mac.
The big problem with the Chromebook is that it’s pretty locked down. I got permission from our IT department to put mine into developer mode (which is usually restricted when enrolled in a GSuite environment) so I could make things work.
First, this is not the same as working on a full-fledged computer. The RAM available on this machine is minimal, which really limits what I can do. It also partitions the hard drive in really strange ways, which makes it hard to keep a neat filesystem.
I started by installing Crouton, which puts a Ubuntu desktop environment on the Chromebook. It’s run in parallel, which makes it nice for jumping back and forth. You can also choose which flavor of Ubuntu you like, from xfce to Unity.
I used Crouton to run Gimp and git, mostly. But, I wasn’t using Gimp as much as I expected and it really slowed down the device. I ended up dropping it in favor of Chromebrew, which has worked beautifully. It’s a package manager built specifically for Chrome which includes things like Git, Ruby, python, imagemagick…all kinds of things that make life easier working on such a stripped down device.
I use a mix of Chrome apps to work in.
- Crosh – Similar to the bash environment, crosh is the Chrome’s terminal emulator. You can get to it by hitting Ctrl + Alt + T. If you’re not in developer mode, most of what you can do is look at system stats. All other functions are locked down. Once you’re in developer mode, you can type in shell and browse the filesystem (Linux-based) just like any other full computer. This is where I run git.
- Caret – Caret is a Chrome text editor that supports syntax highlighting and offline use. It’s based on Sublime Text, so it includes custom keymaps and functions to help the process. https://github.com/thomaswilburn/Caret/wiki.
- **Secure Shell – Another Chrome app which emulates a SSH client. Really handy for jumping in and out of my own remote server as I need things. Much faster than relying on the cPanel through my hosts’s admin panel.
It’s lightweight, but it works well. Chrome’s own developer tools and console are really helpful with autocomplete and error logging (just like any other browser, really).
I was working on student grades in a Google Sheet last night and I needed an easy way to randomly sort students so I could show some score adjustments. Sheets lets you sort A-Z and Z-A easily, but there’s no baked in random function, which makes sense.
I could have scripted it, but it was late and I was feeling lazy. There’s an easier method.
Grab a column and enter =rand(). This will generate a random number between 0 and 1. Click and drag this down the entire range. Then, sort this column A-Z. Hey presto! Random sorting a Sheet.
Notice that the random column changes every time something else is clicked. This won’t affect anything other than the sorting, but it allows you to resort if it isn’t “random enough.”
I’ve been ruminating on a way to use Sheets and Google Apps Script as a fully-functional gradebook. I’m not there yet, but I can see this being helpful in that implementation.
I feel like I’m on a social networking pilgrimage.
I left Facebook two years ago and haven’t looked back. (Well, technically, like Alan Levine, I’m there, but only to manage a page for a group.)
Twitter is becoming super-broadcasty. It’s still a fun space in some respects because it’s the only space I can connect with some dear friends. Goofiness matters. I check it, but I’m only paying attention to very specific items. I also push out things I’m doing. But, there are fewer and fewer replies these days.
Mastodon is a newer, federated Twitter-meets-Tumblr social space that I’ve poked around in. There are definitely some merits, but some things I’m not super happy with. We’ll see, ultimately, what ends up happening there.
Just today, I checked back into Known, both through Reclaim Social and through my own little stream. I’d tried Known a while ago but ultimately abandoned it because I don’t think I really understood how it worked.
When all is said and done, I think I’m looking for something of substance that can go anywhere. It’s really difficult to find that balance, and I’m not sure I ever will. The need for connections is real and it’s what drove me to pour into Twitter and blogging four or five years back. The desire to connect is still there, but the means of connecting are more and more limited even though we have a number of choices. I want flexibility. I want ownership.
I’ve grown up a bunch, and I’m giving Known a shot again because I think I finally understand the power behind the POSSE model. Hopefully, this’ll scratch the itch.
An interesting Stack Overflow question popped up about auto-translating one document into another when edits are made. Most Google services have things called “triggers” which run functions after some kind of event – opening the doc, making a change, etc.
A Google Doc does not have access to the onEdit trigger, so there is no way to automatically run the translation unless you put it on a timer trigger, and that’s a waste of resources, especially if you’re not constantly updating the document. But, you can link two documents together via the ID and push changes made using a custom menu.
Grab a copy of the template with instructions.
Source:
var ui = DocumentApp.getUi();
var docProps = PropertiesService.getDocumentProperties();

function getText() {
  var doc = DocumentApp.getActiveDocument();
  var body = doc.getBody();
  var array = [];

  array.push(body.getText());

  sendTheText(array);
}

function sendTheText(e) {
  if (docProps.getProperty("childId") == "") {
    var prompt = ui.prompt("Child doc ID", ui.ButtonSet.OK);
    var response = prompt.getResponseText()
    docProps.setProperty("childId", response);
  }
  var childDoc = DocumentApp.openById(docProps.getProperty("childId"));
  var es = LanguageApp.translate(e, 'en', 'es');
  childDoc.getBody().clear();
  childDoc.getBody().appendParagraph(es);
}

function clearProps() {
  docProps.setProperty("childId", "");
}

function onOpen() {
  ui.createMenu("Custom Translate").addItem("Run", "getText").addItem("Clear IDs","clearProps").addToUi();
}
Like many schools, our students are asked to wear their student ID’s when they come into the building each day. During the day, they don’t need to have them on…just in the morning so we can make sure people coming in are part of our student body. If a student doesn’t have their ID, we issue a temporary and track how many times they don’t have one when they come to school. This process used to be done by hand each morning. A queue would form and a teacher would write down ID numbers (they all have them memorized) and names. This caused several problems:
- If a student gave a fake ID number, office staff wouldn’t know until much later in the day.
- The paper copy of the ID list was given to a secretary to transcribe into a spreadsheet.
- Transcribing meant looking up the ID in our SIS and then manually entering the number of times the student didn’t have their ID.
- When benchmarks were hit (5, 8, 11), disciplinary action was issued and followed up on by an assistant principal.
I spoke with the head secretary and we worked out a custom Google Sheet to do all of this automatically. Now, the duty station is equipped with a Chromebook so the teacher issuing IDs can quickly check veracity of the given ID and have all of the tally work done. This (mega) post outlines the sheet structure and custom code used to do the work.
The template and source are linked at the bottom of the post.
The Sheet
The Google Sheet is split into four tabs:
- Raw: Blank sheet with Timestamp, ID, and Name.
- Lookup: database of student ID numbers and the associated name/grade.
- Aggregate: ID, Name, Grade, Count, Cons 1, Cons 2, Cons 3.
- Daily groups. Filter, ID, Name, Grade.
Aggregate
The same student can have multiple dates of entry and this sheet aggregates by student ID. Using UNIQUE, it pulls each ID as a single column. Then, I used another index-match function to populate the name and grade. To count the number of missing ID instances, a COUNTIF function worked well to count the number of times the ID number shows up in the raw sheet.
Scripting
At this point, much of the work of the sheet was moved over to Apps Scripts. We needed some dynamic results and using a script to sort through the volume of information was much faster and more reliable than using regular Sheets functions. I’m breaking the code into chunks to better explain the purpose. In the actual sheet, all functions are in the same file.
Function 1: Globals and menu item
I use a couple global variables (not super efficiently, though). I also create a custom menu to run sheet functions. This takes care of creating those items. I have mine at the top of the script, but they can go anywhere.
Function 2: Listing dates a student was missing the ID
For reporting, it was helpful to know which dates a student was missing an ID. Rather than adding n columns to fill with dates, a script was used to look up the student ID number and then add a note to the cell with the dates.
Function 3: Populating a daily list of students
Each day, the secretary checks for students who have hit a benchmark: 5, 8, or 11 missing IDs. Searching through the aggregate list isn’t feasible, so a script does the search and then returns the results dynamically.
This checks two conditions: A) The number of missing IDs is equal to or greater than the target and B) there is no consequence filled in the appropriate column. If the consequence has been assigned, it’s in the SIS and doesn’t need to be entered by the secretary.
Function 4: Assigning consequences
When the office staff pulled the daily list, they go into our SIS and update the disciplinary action or other notes. They would still have to go back and document that consequence being assigned in the aggregate sheet. Rather than scroll through the list, the appropriate consequence for the target is now filled in when the list is generated. The daily list isn’t cleared until the script is run again with a new target.
If, by chance, there are no students to assign a consequence to, a popup is shown to let the user know that no students meet the criteria.
The Result
In the end, we’ve removed two steps from the administrative process, but they were the most time-intensive steps. Rather than looking each student up and then remarking a spreadsheet, the staff member needs to simply pull the list of students for that day.
Computers are great at repetitive tasks, so let’s use them to do those tasks. There’s definitely some optimization that can be done, especially in the last two functions as they pass those arrays around like a cold. If you make updates, please comment and share back. The code is hosted on GitHub, so you can fork and update as much as you’d like.
You can look at a copy of the template or just make a copy for yourself and start poking away.
The entire source (not broken up) is hosted on GitHub Gists.
I used to make fill-in-the-blank notes for my students to complete while watching a video. For a particular subset of students, that works well. Helping lower the barrier for learning by providing a construct for information gathering led to more engagement when it came time to use the information.
Then I took on AP Biology.
Some very wise people told me to teach the material and not provide so much structure. I wouldn’t be able to put in the amount of time it would take to get everything pre-made. And boy, were they right. (I’ve taught AP Chem, but that was a long time ago. I needed their reminders.)
I’ve also wanted to move to a more free-form video…not as structured. More fluid. Focused more on deep content. Trying to write while I spoke at the same time was difficult to maintain. So, in response, I’ve moved to drawing out the lesson notes, scanning it, and talking over the pictures.
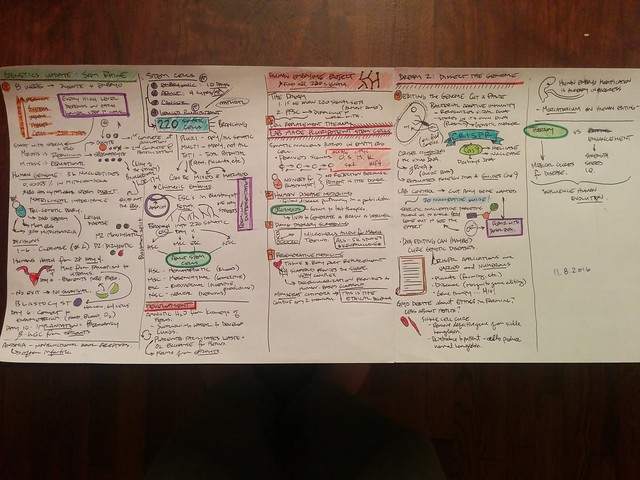
flickr photo shared by bennettscience under a Creative Commons ( BY ) license
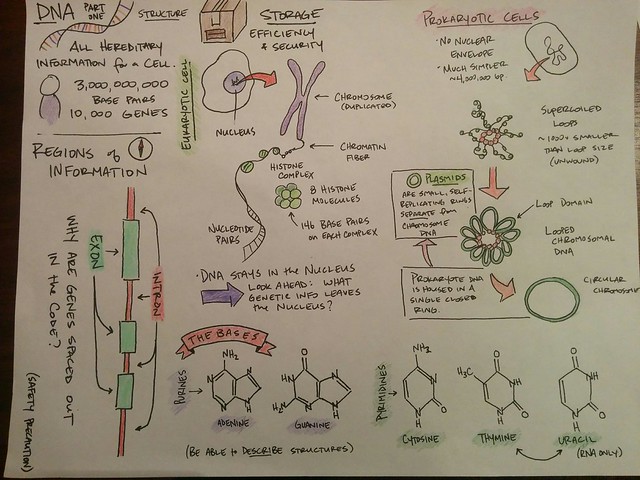
flickr photo shared by bennettscience under a Creative Commons ( BY ) license
This has helped my students improve their own visual representations of the concepts. It’s also helped me tell a better story (all science is a story anyways. Now it’s an illustrated story).
I sketch the notes…maybe 20 minutes to get everything sorted, and then scan it in to the computer. I drop the image into Camtasia and go for it.
Low key, but early indications are that it’s just as effective as fill in the blank. But now, students can fill in their own blanks.
Startup culture ate one of my stories this year and I just found out about it this week.
I check for broken links on my blog. It’s mainly because I don’t like getting emails that such-and-such link doesn’t work anymore from a reader. I try to repair what I can and I remove what’s dead (sites and apps die a little too frequently).
One of my favorite posts from a couple of years back had a broken link, so I went to check it. Turns out, Storehouse, a great storytelling app I used for a while, closed shop in July. Along with it went my photos, videos, and stories published. No notice, no warning. Just gone.
The story embedded on the page? Gone. Replaced with the sad face.

The video of my daughter learning to crawl? Gone.
Shame on me for not backing up better. Shame on us for pouring our stories, images, and videos into a culture that packs up and moves on with no warning.
I’m working with a group of teachers to run a mock election this week. They had a basic Form set up for students to vote along with two other “pie-in-the-sky” ideas:
- Assign electoral votes by homeroom to simulate the Electoral College.
- Have a live-update view of the election teachers could show in their classrooms.
## Electoral Votes
To set up the electoral system, we created a database sheet in the workbook. We listed each teacher in the school and then assigned an electoral value. The next eight columns are used to tally votes per candidate per homeroom. I was able to do this using the `COUNTIFS` function to match the candidate **and** the homeroom teacher.
Another sheet was added to do the electoral tallies. This formula is a little more complex. I needed to grab the data from each row, find the max, and then check which candidate matches the max column. My final formula was:
`=if(and(voteTotals!$D2=0,voteTotals!$E2=0,voteTotals!$F2=0),0,if(max(voteTotals!$D2:$F2)=voteTotals!D2,voteTotals!$C2,0))`
Broken down:
- If all candidates are 0, leave as 0 (it was assigning electoral votes to all three before this)
- If 1 is false, check if the `MAX` value for that row is the same as the candidate header.
- If 2 is true, assign the electoral votes. If false, leave as zero.
It works well and calculates instantly, which is really nice. The columns are then summed by candidate.
## Popular vote
The electoral vote took care of the presidential candidates, but I still needed popular vote totals for all of the candidates. That was a simple `SUM` function pulled from Sheet 2 which aggregated votes by homeroom. I didn’t need to worry about cross-checking against candidates because I was just interested in the totals.
Now that the tallying is done, I turned my attention to the live updates. My first testing was with a published chart from the spreadsheet. You can publish them without exposing the underlying data, which makes sharing results much simpler. But, it turns out, that leaving the chart options as “automatically publish updates” means anywhere from 10-30 minutes later. Not great for a live-update.
After some digging, I settled on the fact that a custom chart built with the Google Visualization API would be the best way to immediately show poll data.
## Coding the Chart
This took much longer than I expected because the Google Visualization API expects you to send a `QUERY` call to get data from a live spreadsheet to draw the chart. I’ve not used the Query language much, and in the end, my data wasn’t structured well enough in the spreadsheet to easily get what I wanted.
Using Google Apps Script, I was able to grab the spreadsheet data and create my own array to then give to the API for the chart.
## Displaying Popular Votes
The teachers also wanted to display the popular vote for all of the elections (President, Governor, Senate, House) next to the electoral data. This wasn’t too bad and I was able to set up a simple HTML table (using CSS `display: table`) to load the live data using AJAX.
Instead of having teachers reload the page every few minutes, the last two lines on the client-side code will re-run each script with fresh data, updating the site on it’s own.
## Why use a web app?
This is definitely more complicated than it could have been. But, I went with a web app approach for two main reasons:
- Simplicity for the _user_
- Data security
They’re collecting some demographic information that they don’t want published, which is one of the problems with just sharing the sheet out with the entire school staff. They also wanted to make sure the vote wasn’t damaged by someone accidentally changing some of the cell calculations.
The nice thing about running a web app is that I can still require a school district login to see the page. Additionally, even if the page were public, it hides the original spreadsheet key because you don’t need it in the client-side scripts. So that spreadsheet data is relatively safe from prying eyes.
Watch for a follow up post with the election results and a wrap up on how using the app went.
We’re using Canvas this year in our district and I’m trying to figure out how to actively (and successfully) utilize the Learning Mastery gradebook alongside the traditional gradebook…sort of a hybrid SBG.
I have Outcomes set for the entire year (the AP Bio curriculum) and I’m assigning Outcomes to each assignment. This is transferring nicely into the Learning Mastery gradebook. At the same time, coursework (labs, tests, etc) are being entered as normal assignments in the traditional gradebook. What I’m trying to figure out is how to weigh the Learning Mastery gradebook into the traditional.
Right now, as far as I can tell, you cannot have the Mastery gradebook results pushed directly into the traditional gradebook. So, I would have to copy each individual Outcome I’m assessing as an individual assignment in the course. I can do it, but it’s far from ideal.
I’m sure there are some of you out there who also use Canvas and hopefully, the Learning Mastery portion of the gradebook. What advice do you have? Any tips?
Our students are required to have their student ID on when they come into the building each day. This is mainly for security, but their ID also allows cafeteria, library, and other office staff to scan their ID for various clerical tasks.
When a student *doesn’t* have their ID, they’re issued a temporary wristband so faculty and staff know they’ve checked in for the day and that their record has been updated. The update process involved a paper copy made at a cart with wristbands being passed to a secretary who would then look up the student and add it to a spreadsheet before adding it to our SIS. Dang.
The head secretary (Deb) and I worked out a Google Sheet that does all of that (minus the SIS portion, but that’s coming soon).
I’ll outline the functions below, but you can [grab a copy of a blank sheet to play with](https://docs.google.com/spreadsheets/d/1MHrQVM0tPql8gx2tKfFlJwc5teNyDx8-LJ1FRulKFv0/copy) if you’d like to tinker or improve.
Raw info in…
At it’s simplest, the staff member at the check in kiosk has to enter the date and the student’s (supposed) ID number. This sheet populates the rest of the workbook.
…rich info out.
Once the date and ID have been put in, some behind-the-scenes magic happens. This isn’t ideal, but for right now, we’re using a hidden sheet with a master record of student ID’s and their associated name. I would like to make this a web-based API call, but it isn’t possible (not a technical issue…internal) right now.
- A staff member enters the student ID into the `raw` data sheet. The ID is cross-referenced in the `lookup` sheet and the name is displayed. This is to avoid students giving the incorrect ID.
- The `noID` sheet gathers unique IDs from the `raw` list so we can aggregate the number of times they’ve come in with an ID. The student name is again pulled from the `lookup` list.
- A simple `countif` formula counts the number of times an ID shows up in the list and aggregates. Those cells also change color using conditional formatting depending on the number of entries.
- Consequence data is filled in automatically depending on the number of entries a student has.
Disaggregating the Aggregate
For reporting, it’s helpful to know the actual incident dates. Going through each row, one by one, looking for a student name (even using the Find tool) can take a while, especially in large sheets. So, we turn to Google Apps Script to do it for us.
The comments in the script should give you an idea of what’s happening, but if you didn’t follow, here’s the general idea:
– Select an ID you want to look up.
– The function looks for that ID in the `raw` sheet. All matched dates are stored in an array.
– Once the loop is finished, the full array is passed to a function which adds the note to the selected cell.
– You can now see the individual dates a student had no ID by hovering over their ID.
It’s done case-by-case and only when the script is selected in the menu so your sheet isn’t trying to constantly update. The idea being that you only use the script when you need to know the dates a student didn’t have an ID when they came in.
What do you think? Leave a comment below, or better yet – make it better and write up your version with a link back here.
[flickr photo by Owen P](https://flickr.com/photos/owenphilipson/26858459235) shared under a Creative Commons (BY) license
This is a new post format I’m going to try out from time to time. I don’t remember where I saw the original idea, but that person suggested going back, reading old posts, and then commenting on changed perspectives as a method of reflection.
I use [Alan Levine’s](http://www.twitter.com/cogdog) [PHP script to dig up wold WordPress posts](http://stackoverflow.com/a/27569816/2278429) by simply visiting [blog.ohheybrian.com/random](http://blog.ohheybrian.com/random) and re-reading. Try it yourself for some vintage bennettscience.
_If you’d like perspective, [here is the original post](http://blog.ohheybrian.com/2014/10/the-new-education-economy-of-free)._
Paying for software continues to be a four-letter word in EDUland. Some of the reasons free services are important are legitimate (I only have so much of my own money to spend) and some aren’t (I’m a teacher, help me out). In particular,
We need to differentiate between the free sharing of ideas and the free sharing of products.
Also, there seems to have been a rise in EDU-ratti who suggest that you give away lessons and your custom materials away for free as long as you remember to buy their book on 50 ways to do that. There cannot be a double standard.
Alan (he’s shown up a lot in my posts lately) [says it much better than I do](http://cogdogblog.com/2016/10/flickr-cc0/):
I get hired to provide them as a service, despite the fact people can use my stuff for free. You make a living from providing services, consulting, ideas, not from digital stuff. If I was a pro photographer, I would hope to make money from the service, not the products. I would get more clients if they can find examples of my work in the world.
Looking back at the original article, I think that was the point I was trying to make. It’s not selling the product (the book, curriculum…whatever) that’s worth the cost, it’s the **service you provide in creating that product.**
The distinction is very small, but again, it gets to the idea that we have to value the time and effort – the service – that goes into creating any product, be it a book or software.
Consider the tools you’re using now. If it’s free, there is usually an option to send some love to the developers through a donation. If not, send them a note and ask how you can buy that person a beer.

