Posts
I remind my students constantly that I can’t help if they don’t do one of two things: 1) Ask me a question when they’re confused, or 2) get something wrong on an assignment. I need to see their thinking, and those two methods – along with my questioning – are the best indicators of strengths and weaknesses.
Lately, it’s spiraled into something much more confounding. Students are stuck, but they refuse to ask _any_thing. Even when I give a freebie, anything-goes offer. When I come by to prompt, they admit to being stuck, but then don’t do the small task to get _un_stuck. So there they remain. And nothing gets done.
And so we spiral.
It’s hyperbole, but I think they feel like kids in the car in Jurassic Park when I come by.

The fear of being wrong – searching for the right answer every time – is something I’ve tried to combat all year long, but it’s still got hold of most of my students. So many are afraid to be wrong, that they’re paralyzed and can’t take the help, even when offered outright. It’s a safety thing…I don’t know if they don’t feel safe because of my teaching style or because of peers…but it’s something that needs to be worked out somehow.
How do you help students get over the initial hump of just asking a question? Even if it’s something as simple as, “What’s the charge of a proton?” A small door like that would allow me to build their confidence and point to small, accomplishable tasks which will help them progress on their own.
Three years ago, my wife and I bought our first home. I can’t believe I haven’t written more on this before (which is partially true. I mention the remodel, along with some photos in an old post.) Time for a mega update – with pictures!
We rushed during the first summer to get the major work done before Meredith was born, which we were able to do.
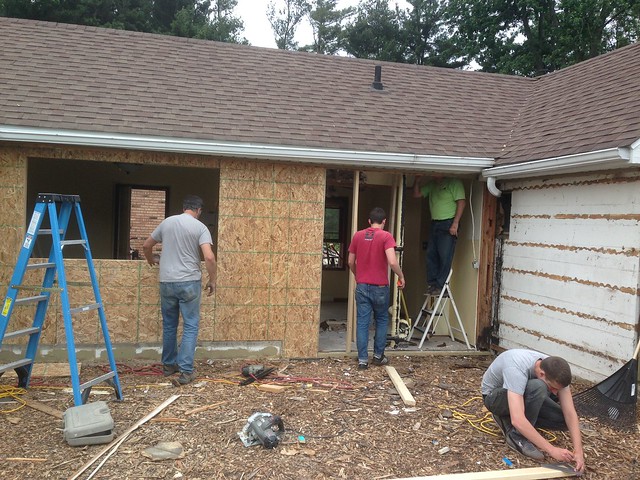
We’d found carpenter ants and some serious water damage on the plate for the wall, so the whole thing had to come out and be rebuilt. That was day 1.
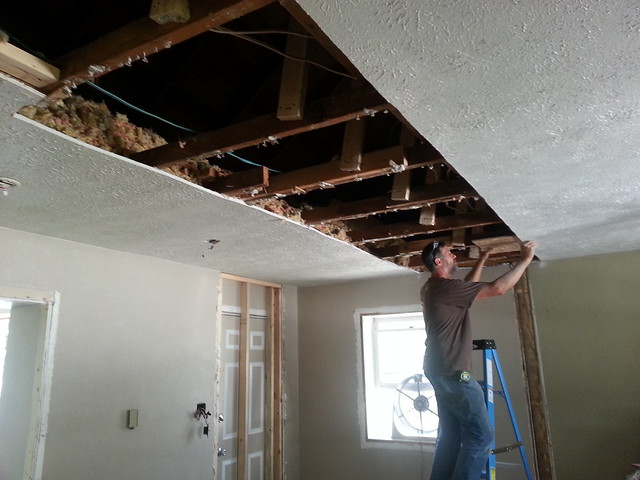
Part of the process involved removing a wall from the dining room, which meant a major ceiling repair as well as refinishing hardwood floors after patching in an old exterior door.
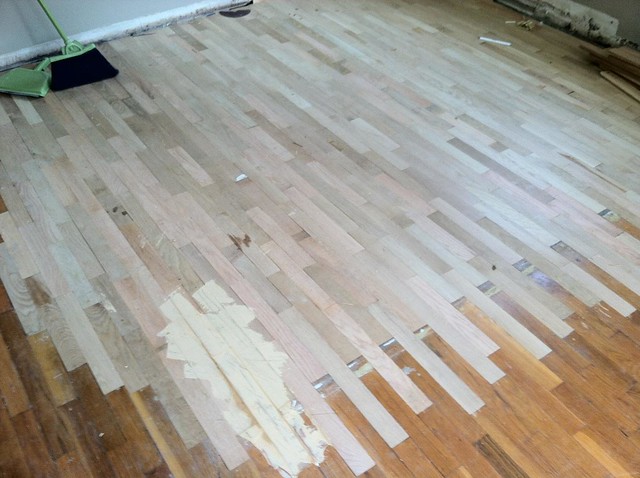
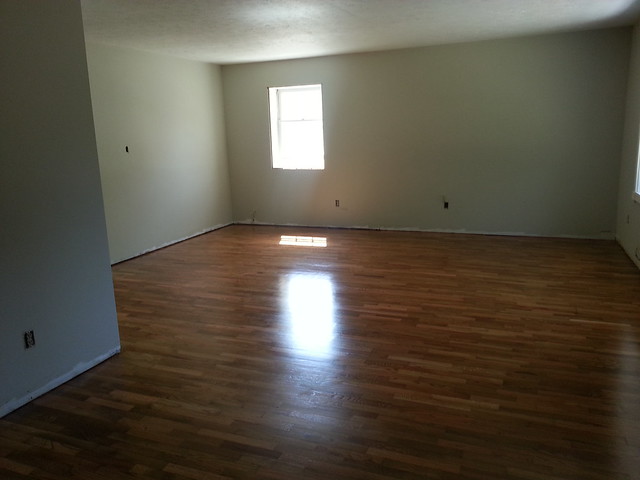
The floors were finished the week M was born.
The summer of 2014 was mostly hired out for siding work from tearing the kitchen wall out the previous year. There were some other structural repairs that needed to be done – new soffits, window moulding, a new window put into the living room…things I don’t have photos for. We finally settled on what the kitchen backsplash needed to look like in the spring, and I got those put in during spring break.
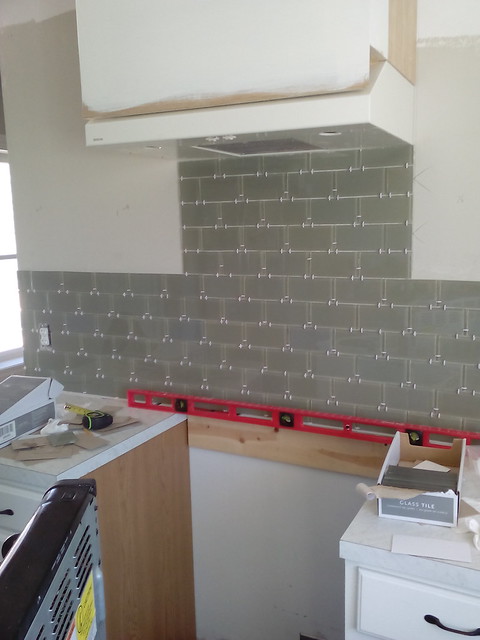
The best part about the backsplash is that the tile we chose was on clearance at Lowe’s, and according to their own policy, they’ll price match. So, a tile that was originally $0.90 each only cost us $0.20 at every store. I bought out northern Indiana and southern Michigan. It was awesome.
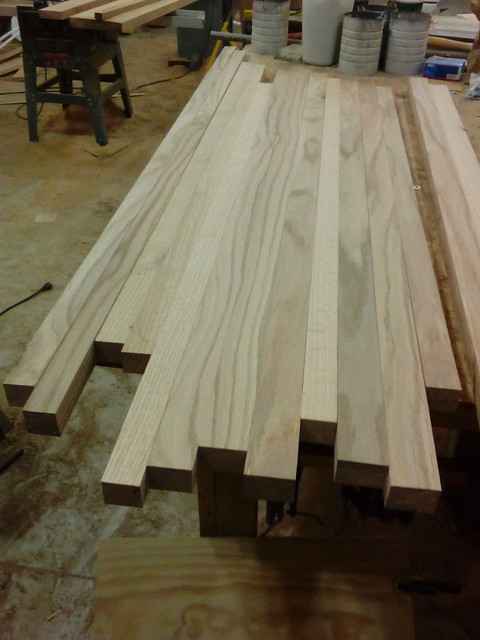
Now, a year later, we’re finally pushing hard to finish the rest of the kitchen. The fridge and some old floor cabinets we owned from our first place in the states are getting a facelift with custom shelves, a new butcher block countertop, and some floating oak wall shelves. We started the butcher block last week by milling down some oak we bought from a neighbor.

Today, I spent a snowy April morning building the new custom shelves.

This week is the week to get it all finished. In addition to the shelves, I’m going to be milling the face frames from some maple (from the neighbor again) and then putting a wall cabinet over the fridge. Everything will be topped with crown moulding along the ceiling when we’re done.
And who says home projects tend to linger…
—
All photos in this post are mine shared via Flickr CC-BY-NC
My grading practices have improved this year. I’m keeping better track of information, I’m using it more often, and I’m showing students – constantly – their progress in their learning. The notion that grades only report ability is buried deep and digging it out has taken a lot – a lot – of work.
Case in point: I’ve already written about keeping better track of quizzes given on standards in class. That spreadsheet, at the end of the chapter, looks like this:

This shows some interesting things:
- I can pinpoint sticking points on specific students much more accurately.
- Blank spots – missing quizzes – really hurts my ability to help. Same idea as GIGO…if I don’t have consistent information from students, I can’t help them as effectively.
- These quiz scores typically improve over time because older ideas set the foundation for new ideas. Yes, there is a dip in some cases, but I chalk that up to complexity rather than ability.
We just took the test and I found myself much less surprised than I used to be. (It pains me to even admit that I used to be surprised…growth…) I can also whip that tracking chart back out and pair it up with test scores.

Yellow is a set of questions related to a specific learning objective for the chapter. For the most part, the yellow boxes correlate with the tracking page. The conversation now centers on, “What mistakes am I still making?” rather than, “What do I have to do to get my grade up?”
It’s also great to ask a student if their test grade is a surprise and have them – even the most reluctant or disengaged – admit that no, it looks about right. Again, we can then focus on closing gaps in understanding and not point grubbing.
I mentioned Evan Weingberg’s standards-based tracking system in a short snippet a couple weeks back. I want to expand on that thought a little bit.
Essentially, he uses a Google Sheet to aggregate quiz performance to make sure standards are actually learned over time. This has been incredibly valuable to me because I felt that students were growing, but had no solid longitudinal data to back that up. It’s not 100% objective (nor should it be), but it helps inform and confirm (or refute) my gut feeling about a student.
I grade my quiz questions on a 1-4 scale rather than Evan’s 1-3 using a rubric I made years ago with significant help from Jenn Binis.

This is posted in my room and helps me give more specific feedback to my students. The quality in responses and in corrections has jumped dramatically. The rubric is also nice because it can be adapted to just about any question.
I give numeric feedback to students on their quizzes, but most of the time, students toss them in recycling on the way out. I’d like to have a way for students to take a look at their longitudinal growth over the course of a chapter. The idea is to take Evan’s original format and create a companion sheet which is specific to each student – some kind of template mixed with doctopus so I can update a master sheet and each student also can see their personal growth on a connected reporting sheet.
I’m not 1:1 this year, so implementing it before the end of the semester isn’t a major priority, but it’s something I’m going to tinker with over the summer to see if I can’t work out.
I’m going to stop doing labs in one of my classes this semester. Regardless of the supports or steps I put in place, there is a general refusal (save for 4 students who are trying their hardest to rise above the din) to follow procedure, listen to instructions, and work safely.
The class itself has become its own distraction. There lacks a visceral awareness of how actions impact others in the room, which has led to a general disregard for any form of structure. Labs are highly desirable because of the experience students get with the science, but they’re not teaching anything. It’s effort I put in that isn’t spent on a significant learning gain. It’s also creating liabilities.
It’s all the more frustrating because I think they could do well with labs, but the class is fighting me for control. Power struggles aren’t suited for the lab space. For now, we’ll put those on the back burner until such a time we’ve regained enough self-control to work safely and effectively.
Growth is a process and this year, it seems to be an extra intense one.
I use Google Sheets in my classroom a lot. I used to rely on combinations of the vlookup, importrange, and index/match functions to get information, but I’ve recently switched to using if and filter to return arrays of information from master spreadsheets.
Using filter is nice because it takes multiple conditions and you can set which columns of the array you want to return for your summary sheet. A pretty standard search looks like this:
=if(filter($A$2:$A,$A$2:$A=$F$3)=$F$3,filter($B$2:$B,A2:A=$F$3),"")
Here’s a sample spreadsheet so you can see how the result is returned after changing the filter term.
So, let’s break it down:
Cell F3 holds my search term, “A”, “B”, or “C”.
(filter($A$2:$A,$A$2:$A=$F$3) – Filter looks through a range of cells ($A$2:$A) for a specific condition ($A$2:$A=F3), much like the IF statement. The exception is that this only returns the matching content rather than a boolean (true/false). The filter, in this case, is serving as the boolean check for the IF statement it’s wrapped within.
=If() – This function is super helpful because it limits what happens in the sheet. It’s like conditional formatting, but for your functions. It takes two arguments, minimum, but you can set up to three: the condition to check, what to do if true, and what to do if false. In this case, the conditional is set with the filter function (see above). If the filter returns a cell with an “A” in it, the TRUE condition is run.
filter($B$2:$B,A2:A=$F$3) – If it’s true, I want a different column returned. In this case, it’s the names of students with group “A” set. Filter works the same way, except this time, it searches for column B (the names) that match the search parameter (“A” in column A).
In other words, the function reads like this:
- If
– filter through column A
– Look for cells that contain “A”
– If an “A” is found, the IF statement is TRUE
- Execute the “TRUE” parameter
– Print the student’s name in the cell
- If not, leave a blank cell
I added a third column, which prints the student’s project content just to show how these functions can be used in conjunction with one another.
I know you can use ARRAYFORMULA to do essentially the same task, but using ARRAYFORMULA doesn’t allow you to add custom content in the column – the throws an error saying data cannot be overwritten. I don’t run into that case often, but it’s often enough to be annoying.
Again, this is difficult to see without checking out the example spreadsheet. It’ll take some playing, but once you get it, it’s very helpful. Leave a note in the comments if you get stuck and need some help working it out.
I did something I normally don’t do: I had my students play a computer game for class the other day.
We’ve just finished nonrenewable resources – specifically coal and oil. We rounded last week out with a portion of the documentary, Switch, which gives a great nonpartisan look to oil and coal use in the developed and developing worlds. Students understood – in theory – that we are facing not only environmental challenges, but economic as well.
I’d been trying to come up with some kind of simulation for students so they could really experience that economic and environmental conflict. I didn’t really find a good one, so I booked one of the computer labs and we played Energy City. It’s a game created by The National Geographic Society and The JASON project. Think simpler SimCity with less people-managing and more resource managing.
I liked this as an inquiry activity because most students dive right into producing energy with coal and oil because it’s cheap and powerful. They tend to focus more on saving and making money rather than conserving environmental resources. It was often too late to come back from failure by the time they realized that air quality and overall environmental health don’t recoup nearly as fast. A lot of games ended in losses pretty quickly.
It really helped students understand they need a balance. They couldn’t dive in without projecting long-term costs. Most started looking at the per-turn cost rather than the up front. They also looked at what actually improved their environmental impact rather than degraded.
Some things I’m thinking through this week, written here so I can find them later.
– Evan Weinberg has a good string of posts on his blog related to student assessment. This one in particular has me thinking through 1) what I assess, 2) how I’m assessing, and 3) what information I actually get from students on the assessment.
– I really struggle with setting consistent classroom expectations, which has led to a lot of the frustrations I’m dealing with in class.
– My instruction, even though I often call it “student centered,” is still too focused on me.
– But I’m not sure, because of the two items above in conjunction, that I’ve moved my students to a place where they can be self-directed more often.
– The influence of standardized testing on our students is increasingly negative and I need to keep a positive attitude during the testing windows even though I’m incredibly frustrated.
– I need to make consistent time to either code or read, because those have helped me relax more than anything else these days.
This semester, a few classes asked for bi-weekly review over the entire year so they can keep old material fresh. I was really happy to get these requests because it shows a higher level of maturity than I’ve seen lately and that they recognize that old stuff still applies.
State testing starts this week (blargh) so I decided to use Friday and today to do some review over forces with a paper airplane challenge.
We spent some time discussing balanced and unbalanced forces, what causes acceleration, and what forces might be acting on a moving aircraft. Then, I tasked groups of three with building aircraft that would 1) fly really far, and 2) stay in the air for a long time. It’s tough to do because you can either go right for the glide or shoot for something that handles projectile motion a little more effectively for increased distance.
Most groups split the difference with an in-between design which led to pretty consistent success on both counts.

The lab isn’t perfect. There are things I’ll change for next year. It would be great in the forces unit, but I think I’ll keep it as review because 1) it’s a good break up of the monotony, especially in testing season, and 2) we can apply material immediately rather than slogging through principles.
Plus, it’s hard to be discouraged with the state of education when you hear cheers about a paper gliding for 20+ meters down the hallway.
Here’s the document if you’re interested in running this with your students.
Test prep is becoming more insidious. Rather than being outright drill-and-kill for the multiple choice marathon students are forced to take, now it masquerades as “critical thinking skill development” and “article analysis.”
We’ve spent the last few months at school designing writing prompts based on articles. We then had the students read the articles, discuss the topics, and do a written response on it. Not because that’s good instruction (I’m not saying it isn’t…) but because that’s what the almighty test has them doing now.
Test authors and companies had to get sneaky. The pushback on high stakes testing has hurt business, so they changed the format. Students are now tests on analysis and critical thinking. But, it has to fit within the acceptable parameters of the item.
Indiana is particularly bad this year. My high school students will take the test for a total of eight hours and thirty minutes this year (starting this week). And that was shortened from the original 12 hour draft released by the state. At the same time, Pearson will make $72 millon over the next two years to tell me what I already know about my students. We will also continue to pay CTB-McGraw Hill another $68 million (after losing the ISTEP contract because of repeated errors) to create practice test.
Indiana’s total testing bill over the next two years: $133.8 million.
And I’m having my copies counted to make sure I don’t print too much out.
Hours and hours wasted this year, as in years past, and if patterns continue, for years to come. Protect your students, protect your time.
Now begins my grumpy time of year. We have ~60 school days left, 28 of which are slated for testing in Indiana.
The Hippocratic Oath really parallels education. More on that somewhere else.
I cannot play at God in my classroom. I am not a dictator. My role is to provide an environment and situation in which students can learn. I work hard to do that. I take that responsibility very seriously.

Choices are made by students to either trust me in the process laid out or to try their own road. Some can definitely handle their own road and I’m proud and thankful for that. Others need to be carried a great distance before they’re ready to walk on their own.
But I cannot make it happen. It isn’t my responsibility to make the choice for students. It never will be.
I can’t hold myself accountable for decisions that aren’t mine.
I’m not a doctor, but I think this idea stands out the most.
Before I dive in, I think Justin Aion and I are parallels of one another in the multiverse. His day was similar to mine.
—
Six weeks into this semester, I have three of six classes with averages in the 50% range. Some of those classes include students with sub 30% grades. Most of it is from choosing not to engage in any way, shape or form. I’ve tried blanket policies. I’ve tried meeting in the middle. I’ve tried strategy after strategy to no avail in some cases.
So I sat down with each class and asked them what to do.
Five of my six classes had fantastic conversations about the choices that have been made. We’ve talked about why we come to school, what the purpose of the class is, why I do what I do…it was much more insightful than I expected. But, there was still business to attend to.

Most classes came up with conduct agreements that we all signed (students added their names to a Google doc which I then printed and signed) and are now hanging up on the wall as a reminder of what we’ve all agreed to. It includes things like:
– One day each week to go over the week’s stuff to make sure we’re all on the same page.
– Group roles (similar to POGIL) to be used any time group work is being done, not just special tasks.
– An actual tray to turn papers in to, not just the corner of the lab bench.
– An actual dedicated place to find extra copies of stuff (rather than relying on me).
And then the elephant: phones.
They’ve been a problem for the majority of my students. Some classes more than others. Most agreed to a Phone Jail system where the phone goes when it’s reached the limit. They came up with particular infractions which will be self policed (that’s the idea anyways). I’m the final say in Phone Jail.

I’m trying to keep it lighthearted. They know when they’re distracted, I think calling it out with something silly/serious like Phone Jail will help.
All in all, I think they were healthy conversations that helped us all understand each other a little better.
—
Then, The Class Who Chose Not To Choose.
I prompted, they were silent. They came up with, “You need to be more strict” and “Just kick people out.”
Another asked, “Dude, why are you asking kids how to do your job?”
That was a good one.
It’s sad that our culture is one in which students can’t imagine a better way to work together. I’m the teacher. They’re the students. What I say goes (unless they disagree with it, of course).
I made it very clear that their indecision and unwillingness to work with me meant lockdown. No phones, no freedoms to choose seats…nothing. I was met with silence. When we got to work and I gave two students a phone warning…well, you can imagine how that went.
—
Changing culture takes time. I have to remind myself that it’s a multi-year process. I’m blessed that the majority of my classes are willing to try and address culture shifts. It’s jarring when one group of very talented people choose not to take that step of faith.
I’ve been working very hard this year to make sure students experience science – or the process of science – as much as possible. Physics and chemistry are real and they matter to us. It’s my job to help them see why they matter to us.
Placed into a school context, I ask students to prove that they’ve learned something. I grade based on standards with a very simple standards-based method (based largely on Frank Noschese’s writing): if you know it, full credit. If you don’t know it, no credit. I don’t fuss with percentages or sliding scales. The objectives (standards has a different connotation to students, more on that another time) weight in at 80% of their final grade. I still give tests and quizzes which can demonstrate the learning, but students are free to show me what they know at any time for credit.
I’ve run into an issue where students memorize snippets in hopes of earning the objective. It’s a checkbox to them. I’m trying to show that learning is more than the simple recitation of information. It’s the sum of the experiences and, more importantly, what you do with those experiences.
I get this way every time I give a quiz or test because I have to constantly reiterate the importance of learning, not just in “passing.”
Waves are tricky to teach. Students feel like they already have a ton of experience with them (you’ve been to the beach somewhere, I’m sure.) and that there isn’t a whole lot more to learn. So, I try to make it hands on and connect with other areas of interest.
For instance, I brought my guitar into school. Music is waves working well together. So, I fiddled around during class while they were working and had them make connections between the guitar and the theory of waves. A few days later, I moved into a NOVA episode about the 2011 Japan earthquake and resulting tsunami…more waves. Students were able to connect the abstract – longitudinal and transverse waves – with the concrete – P and S seismic waves. At this point I introduced the earthquake lab.
The Setup
Students broke into teams of four and assigned roles – Project Manager, Treasurer, Research Director, Architect – based on their interests. Their task was to build a building at least 40cm tall out of spaghetti, marshmallows, and tape which would stand up to an earthquake. I modified this doc (Word download) and gave one sheet per group.
The Challenge
When I assigned this task, I said the structure had to be at least 40cm tall, but I didn’t tell them that it should be as tall as possible. Some groups naturally went for it (one group hit 98cm!) while others played it safe. Next time, the height challenge will be added.
Also, if you look at the document, I dropped the line of credit to $4000, thinking it would make them think through their designs. I also limited their trips to the store (me) to two visits to really make sure they designed. Nearly every group was very intentional, but I still wish I had added the “economy” challenge to the height: tallest building you can make (at least 40cm) while staying cheap. Things to remember for next year…
The Shaker
The final hurdle was designing an earthquake machine that would shake every building fairly. I also wanted them to see the difference between P and S waves, so it had to shake on two axes. I tried to work through a couple of ideas which would have required cranks, drills, drawer sliders, and lots of engineering and instead landed on something sweet and simple: a tone generator on our LabQuest sets and a hacked apart speaker.

P Wave arrangement. Speaker is mounted below the platform.

S Wave arrangement: lateral speaker with the LabQuest hooked up.
I used some 10-gauge house wire and industrial strength hot glue to add some hooks to the speaker baffle. A small power source let me control the volume of the tone being generated. I drilled holes through a small whiteboard to mount on top of a speaker (P waves) and beside a speaker (S waves). We ran the P waves at around 25Hz and the S between 10-12Hz. The goal was to show students how properly-built buildings resonate with the shake, not fight against it.
It gave a pretty good shake…my speakers this year were a little small, but it worked well to show resonance. I think if we went for height next year, we’d get a few more building failures, which are just as important as building successes.
—
Thanks to Anthony Purcell for making sure I wrote this up. Leave a comment if you want tips on building your shaker.
I’ve done a ton of labs with students this month. We’re learning about waves and there are some fun demos and experiments you can use to illustrate ideas.
My absolute favorite tool is: my cell phone and a ring stand with a claw clamp.

Don’t put a ring on it.
I’m now super mobile and can film some sweet science action to use in videos, post on the website, and just generally have in my back pocket when I need something.
Like today, we were discussing how waves travel faster through some media (solids) than others (gases). So, I set up two rows of dominoes, one spaced tightly and the other less so, and let the science happen.
Can’t see the video? Try looking [here](http://blog.ohheybrian.com/wp-content/uploads/2016/02/domino3.mp4)
I have a lot of other examples, including a couple which will have their own posts…someday…maybe. If you don’t teach science, ask your friendly neighborhood chemistry teacher if they have an extra stand and clamp. Or, just head over to Amazon and grab yourself a little phone tripod to have. It makes a ton of difference in how you think through teaching a lesson and the more you use it, the more opportunity you’ll find.
My video was rambly this week. I think it’s because I have complete control over my environment, but there’s just not much I can do with it. I have a really small classroom and some big classes, so it gets packed quickly.
It’s easy to fall back into default “classroom mode” where desks are in rows for ease of movement, which is important. If you can’t do what you need to do because the arrangement isn’t working, (but hey, they’re in groups!) you’re environment still isn’t flexible enough to push students into owning their learning.
I’m pretty open about where students sit. A year ago (nearly to the day…wow…) I wrote about seating charts and they’re influence on the environment. I’ve resisted making new charts this semester because I’m shooting for the right balance in the room. This ties more in with the culture, but the physical environment is affected: who sits where, how does their interaction demand attention from the space, etc.
Being flexible with the environment starts the change. Being okay with (sometimes) big groups of kids helps send a message that learning is collaborative. Moving around your space (yes, it’s okay to have a desk and a space of your own) so you work more effectively in the classroom space will also help make that transition. Since moving my desk, my interactions have improved, my rapport is better, I feel more aware, and students expect more interaction from me. All good things.
Ken Bauer has more energy than I know what to do with. I met him two or three years ago (something like that) and ever since, he’s taught courses, advanced in his university position, joined the FLN board, and really just been a great friend.
Ken is running an open course (a cMOOC if you want to get technical about things) on Flipped Learning over the next eight weeks just because. He organized everything, set up the website and syndication, promoted, and is now managing 40+ people going through the course. I helped out last year by hopping into a hangout or two with some folks to talk about the Pillars. But, I wasn’t in the classroom – I was an invited guest.
This year, I’m back in the course because I’m back in the classroom, trying to work out a lot of the same problems I thought I already had answers to. Kudos if you can follow that deeply meta line of thought.
I’m hoping to reevaluate what I think about flipping. Paul Andersen talked about his love/hate journey with flipping last year at the annual conference. We continued the discussion on a boat. I think I’m paralleling his journey now…I like the idea, I’m frustrated with the implementation and bottle necking (some of which is definitely my fault), but I think it’s still the right thing to do.
I want to find balance. I want to rework my understanding of what I do and why I do it. I want to articulate what flipping looks like for me in more concrete terms when I’m asked. I want to see what other people do. I want to be challenged.
I’m really looking forward to the next eight weeks.
I’ve been looking forward to teaching electricity all year. I’ve never done it before and I was excited about the hands-on stuff you can do. Who doesn’t want to play with batteries and light bulbs?
Seriously.
I split the lab into two days. Rather than prescribing circuits, I knew I wanted to make it inquiry-based. There are limited variables with simple circuitry and I wanted students to find the connections and patterns on their own.
Day 1
I put together kits for students with a D cell battery, some Christmas lights I cut up the night before, and aluminum foil to serve as a “wire.” Each group was challenged to make five working circuits.

The struggle was real. The success was even more real. Smiles all around; shouts of joy when the bulbs lit up or turned off when they were supposed to. Plus, lots of shrugging and smiling from me as I avoided answering anything, which was fun.
Plus, I got my favorite answer ever from someone on the last question…

The circuit diagrams were based on a model on the board with unlabeled components, which helped them struggle through drawing a nice, clear design. At the end of the day, most students could draw a diagram based on the apparatus they had built.
Day 2
Time to put the learning to work. I still haven’t taught anything about how to split the voltage across a series because I wanted them to make the leap of faith themselves. This lab required the students to read a circuit diagram to use the voltmeter and ammeter. To simplify (and reduce the stress of lab time) each group had to choose to measure volts or amps. If they finished early, I let them finish taking data on their own rather than swapping with another group.

Again, I refrained from answering direct questions as much as possible because I needed them to not only be able to draw a diagram, but read an unknown given to them. They rose to the challenge and, for the most part, were able to get at least one data set completed by the end of lab.
——-
The struggle was real and the payoff was satisfying. The goal was achievable and success came quickly, which spurred more effort on the harder challenges. This lab is definitely a keeper for next year. To improve, I’m going to make a better connection between the labs…some groups said they didn’t see the pathway I was trying to set up. Either way, it worked great and I’m already looking forward to putting the pieces together next week.
To top off the great day, Batman swung by with a friend.

I gave up using Jetpack a while ago on my blog because I couldn’t control where it sent information. I wish it was more modular in nature because it is helpful. But, I don’t want visitor (read, your) information sent off to unknown folks to do unknown things. So, I turned it off.
I’ve slowly added functionality back since turning it off one plugin at a time. Plugins are nice because all of the data is hosted right with the blog – there’s no sending things to third parties. At the same time, it’s a little more upkeep on my part to make sure a plugin doesn’t break and send the site all wonky.
Right now, I’m using the following:
– Akismet – Essential for spam blocking. As of right now, it’s blocked 17,000+ spam comments since I installed it way back when.
– Email Subscribers – Some folks still like ye olde notifications via email when a new post is published. This plugin lets me set up custom emails for those notifications, which is nice.
– Send email only on Reply to My Comment – I love how straight to the point these guys are. “What does this plugin do?”, “Read the name.” This adds comment notifications back in but allows users to choose when they want those emails. These are also personalized in the settings.
– WP Power Stats – I write for me. But sometimes, it is nice to scratch the “how many people visited this week?” itch. It’s also nice because it shows browsers people visit on, which helps me make decisions about updates.
– Typewriter – This lets me write in Markdown because I like Markdown. Do I need a more valid reason?
– WP-Gistpen – I’ve been posting more and more code lately and this little guy lets me grab snippets from Gist, which is a super-handy snippet repo from GitHub.
Nothing fancy. And only what I want. All managed by me, on this site, with no third party reaching in for that information.
—
This is the third anniversary of Aaron Swartz’s suicide. He was a champion for data privacy and the idea of a free and open internet where ideas are shared. I didn’t hear about him until two years ago, on the first anniversary.
Maybe his story stands out because he did things like co-author RSS (yes, that RSS which syndicates just about everything on the web), start a non-profit (Demand Progress) which successfully, among others, beat the cable lobby for substantial Net Neutrality rules, or maybe it’s because he was my age.
Whatever the reason, data is important, and it’s not something I take lightly any more. Yeah, it would be easier to just use Jetpack, but at what cost? Information is a commodity, but it’s not one that benefits you or me.
The fact of the matter is that we are all responsible for the health of the Internet each day. This is my little part.
We’re working very hard with students on annotating articles in preparation for the new state test sections. The goal is to help them find pertinent information in multiple texts which can be used to construct thorough written responses. We have a standard format…circling unknown words, underlining main ideas, etc, which help students transfer the skill from class to class.
Finding relevant articles means lots of searching online. Once you find text, it helps to format it for use with students. I like giving students wide margins for notes as well as nicely laid out paragraph numbers for reference in discussion and writing. It took a long time to copy and paste each article into a table cell and reformat, so I wrote up a simple Google Apps Script to do it for me.
It works through the document, checking paragraphs (line breaks in Google-land) for text. If there’s text, the script copies it into a numbered row of the table and then deletes the original. What you’re left with is a nice copy of the article to print out and use with students.

Here’s a template document you can make a copy of and play with. If you have questions, send me a tweet, @bennettscience, or leave a comment below.