Posts
I missed two days of school last week. One day gone is enough added work on it’s own, two is nearly unthinkable. I wanted to make sure my students did something meaningful – as always – but without the need for a substitute to try and manage device access, etc.
I think one of my favorite definitions of “rigor” has to do with the cognitive task and level achieved by students as they work on a task. It isn’t related to the “difficulty” – perceived or inherent – as each student can jump to higher orders of thinking at various points in any given task, thus achieving rigorous thought patters. I’ve spent a good amount of time this year reaching for that goal in all lessons with some success and some failure.
I designed a task in which students spiraled up through an idea by first approaching the knowledge I needed them to have through applying skills developed as part of the knowledge-acquisition phase. We’re about half way through a unit on motion, so a lot of what they worked on included some prior exposure.
Part 1 – Introduction
This portion’s role was to help solidify and formalize information. Definitions of terms and basic application questions were geared to help frame the rest of the activity. This page was meant to be a warm-up; something to help get the juices flowing. The questions here were recall or lookup only.
Part 2 – Skill Acquisition
A major part of the motion unit is knowing when something has changed its position. This is a deceptively simple statement. We’re so used to movement in our lives that we lack the vocabulary to explain what motion really is without practice. (If you want to see this in action, ask students how they know when there has been movement. You’ll get some interesting responses.) Part 1 gives them the vocabulary necessary. Now it’s time to start developing skills.
Maps are essential in describing movement every day. We Google addresses all the time to get from place to place. Part 2 asked my students to interpret a map of our city with five locations laid out. Before even layering motion into the task, they needed to identify the locations and measure distance and displacement of each one. We spiraled back to ideas in Part 1 to formalize the context. The point of this section was to marry the information with the skills necessary to complete the task.
Part 3 – Getting Around
Now that students had a vocabulary and a skillset to get around town, they had to tackle one final task. I provided a hypothetical schedule of events they had to get to throughout the day. They made up a driving schedule based on that information and then linked it to the distance and driving time using local speed limits. Finally, they took all of that and turned it into a position/time graph, which they’ve been reading for weeks now.
The entire point of the task was to help them see the application of small ideas in every day life. Every time we make plans, we go through this process – when do I need to arrive? How long will it take to get there? Which route should I go? Familiarity with the fringe of content is both an entry and a barrier: we can use it to break the idea open though context or we can struggle with helping students see the underlying ideas.
Feel free to take a look at the Google Doc with each component in order.
One of my goals this year is to help students struggle productively with ideas before I loop back to teach it. I don’t remember who said this first – probably Dan Meyer, Frank Noschese, or Kris Shaffer – but it makes a lot of sense. It builds anticipation and allows students to find and build meaning with the discrete ideas before they tackle them.
I tried to do this with my introduction to motion with my physical science students. I started with Dan Meyer’s TEDx Talk which highlights a ski lift problem and how he broke it down for students. I tried something similar by asking students to describe the position of each ball to the other using this picture:

The goal was to have them feel the struggle of explaining a position without any reference point, two very important foundations for movement. Instead, I confused kids without offering any direct path to resolution. Why circles? Why are some “higher” (again, no frame of reference, so they could be lower…) than others?
Frustrated, I tried again with a variation on the same picture with a different class:

This became too easy – they didn’t see the need for using a coordinate system because they could describe – well enough, at least – the relative position of one ball to another. I had missed the mark again…I hadn’t created a situation in which a coordinate system was essential for describing motion.
At this point, I sent out a tweet asking for help. The minute I sent it, I realized that the image was way too abstract to make any sense. I thought the framing I had done for students in the room was enough, but it highlighted the fact that I had pseudotaught rather than actually taught anything leading up to the discussion.
I tried a different tactic. I made it a game. Here was the picture I came up with:

I stood at the board and grabbed a marker. I then closed my eyes and told my students to get me – verbally – from one of the people to the other.
It was like the Price is Right. Directions, shouts, and redaction all flew at me. I let them argue over where to start and where to finish for a while. After a try, I stopped and asked what would have made it easier. They immediately recognized that labels would really help in descriptions. We set directions and names. Trying again, the class was able to identify which two people would be connected.
Then, I asked them to tell me exactly how far away one person was from another along the path. This set the stage for the coordinates. If you’re in an airplane looking down at this group of people, you can’t land, grab your measuring tape, and start counting centimeters…it isn’t practical. Some classes took longer than others, but eventually, they realized that a grid would work, which let us set exact positions for the people.
It took me the better part of a day to really get down to an okay situation for students to struggle with. I’m still not entirely happy with where we landed, but it worked. The hardest part of creating struggle is finding the sweet spot between not obvious but not too abstract. I’m still trying to incorporate struggle, mostly through having qualitative lab experiences before teaching an idea, and it seems to help build a proper frame of reference for the instructional stage. I’d still appreciate any tips you may have for building these experiences in your classroom.
Marc Seigel is always doing great things in his classroom and he tweeted out a great picture of a bulletin board that now lives at the front of his room.
My new bulletin board at the front of the #roomofawesome No more boring announcement board. Now positive messages are what the students will see every day.
A photo posted by marc seigel (@daretochem) on Aug 20, 2015 at 7:49am PDT
I’m working on making my Word Wall (more on that some other time) and my biggest beef is how long it takes to go through and make each word look nice. Selecting each term, changing the font, changing the style…way too long.
So, here’s a script that will do the same thing.
The script has an array of the most readable fonts in the Google Font library. If you want to add others, just add it’s name in single quotes on line 20.
Words go on their own line in the Google Document. When you add the script, reload the doc and a special menu will appear at the top where you can run the script. It loops through each line, applies a random font style, changes the font size to 48px, and then randomly applies bold formatting.

You can grab a view-only version of the document for your own drive. Instructions are also in the document.
It’s been an intense week of teaching, church band practice, and Google Apps Scripting. I’m really focusing this year on using the computer to do what it does well so I can focus on doing my job better. In particular, I’m using the desktop to do repetitive, marginal jobs as efficiently as possible.
This week, I’ve got two new tools in my belt to help out.
docTranslate
I happen to have a higher number of ESL students this year, some of whom are brand new to the country. Besides feeling more and more awkward about only speaking one language myself, I needed to find a way to help them with the language barrier.
After speaking with our ESL specialist, she gave the okay for me to print Spanish on the back of my English notes pages. (I was concerned about creating crutches, but she assured me that it would be more helpful than harmful in the long run. I need to learn Spanish.) Taking my notes, one by one, and putting them through Google Translate would have taken way too much time. So, I turned to a script.
doctranslate.gs
function translate() {
var doc = DocumentApp.getActiveDocument();
var body = doc.getBody();
body.appendPageBreak();
var elements = body.getNumChildren();
for( var i=0;i
This script is still a little incomplete, but it does the trick. You can read through the code to see what exactly each section does. I’m probably going to turn this into a Doc Add-On in the future, but that’s a little fuzzy right now because I can’t imagine when I’ll have the time to do that at this point. Some things to pay attention to:
- All images and drawings have to be inline for it to work. Googles Apps Scripts can’t see other types of images yet. It’s faster to make the copy and then reformat how you’d like.
- Formatting isn’t always carried perfectly. Again, it’s about the minimum-viable-product right now. Spot check the translation for format errors if that matters to your doc.
- This is document-specific…at the moment. You’ll need to recopy the script each time you want to use it.
I had a fluent Spanish reader check the grammar (Google Translate can be notorious for some weird translations at times) and he gave it a thumbs up, so take that how you will.
driveBox
Whiteboarding is a big part of this year in class. I want students investigating, collecting information, manipulating it, and building an argument. A lot of times, class ends before they have a chance to get clean work on paper. I needed a way for them to send photos of their work in at the close of class.
Of course, email is out. I guess that makes me old now.
We’re barely scratching the surface of Google Apps for Education at school – teachers are starting training this semester and student’s haven’t had their accounts opened up yet, so sharing back and forth isn’t really possible yet.
Some Googling turned up a great alternative, still using Google Apps, to create a public dropbox with scripts. In 20 minutes of finnagling, I had a working dropbox page which allowed students to submit things straight to my Drive with three taps. I’ve modified mine slightly from the blog post linked above. Unlike the translate function, this one requires two files.
server.gs
function doGet(e) {
return HtmlService.createHtmlOutputFromFile('form.html');
}
function uploadFiles(form) {
try {
var dropbox = "Student Files";
var folder, folders = DriveApp.getFoldersByName(dropbox);
if (folders.hasNext()) {
folder = folders.next();
} else {
folder = DriveApp.createFolder(dropbox);
}
var blob = form.myFile;
var file = folder.createFile(blob);
file.setName(form.classPer + form.myName);
return "File uploaded successfully. You can now close this window.";
} catch (error) {
return error.toString();
}
}
Those blocks of code turn into this:

Pretty easy to figure out what to do.
If you’re interested in using either of these scripts, let me know on Twitter – @bennettscience and I can help you get them set up. Like I already mentioned, I think the translate function would work well as an Add-On, and if I get there, I’ll write another post with instructions on how to get it.
More on the scripting I’ve been doing lately…
A while back, I wrote about a new Google Sheets response system I created for use in class. I suggest you go back and read that first if you haven’t read it yet.
First, I uploaded the template in to the gallery. That’s the best place to download and use the spreadsheet because everything copies over correctly.
The biggest update is in the setup process. Rather than posting a URL on your board, it will now create a QR code automatically for your students to scan.

Notice the tab at the bottom wasn’t there before clicking the button – it adds the code to a new sheet. You only need to do this once because the other functions (outlined in the first post) clear out responses in the template with each question.
In my continuing effort to make things more available for students, I’ve started rearranging my Google Drive files. I’ve realized that thinking of Drive as a traditional file system isn’t as effective as using it more like a topical organizer and then power searching for quick results. Because of this change in mindset, I’m getting rid of all of my old unit packets (as traditionally defined) and moving individual pages (notes, assignments, etc) to one big “Handouts” folder. The main reason for this is so I can quickly and easily create a la carte handouts for students missing papers, school, etc. No more trudging through packets and printing one page before hunting for another.
From the last post, I’m also rebuilding my class website to make it dead-simple to find information. In short, lots and lots of descriptive links.
Everything is going to be fed through the individual document this year.

From the document, if they’re accessing on their phone, the title of the page jumps them to a YouTube video for help. On the other hand, if it’s a handout they get in class, the QR code does the same thing. Access. It’s important.

Since I have a lot of handouts and a lot of videos, making a QR code for each one is time consuming. But, thankfully, Scott MacClintic came through in a big way. He shared a blog post which outlines making QR codes using Google Sheets.
I ran into an issue copying the code from the blog post (plain text is important!) If you want to use a sheet similar, use the code snippet below.
One more short note: QR code complexity is determined by the number of characters you’re encoding. So, longer string, more complex code. Using a URL shortener to make your string fewer characters is a good idea. Then encode the short URL. Again, this is something a script can do wonderfully. This WebApps post has code snippet (also below) which you can use in the Sheet you set up. If you’re curious, here’s mine.
The best thing about this is that using the Sheets method means I don’t have to download each one locally – they’re saved in Drive. It also makes updating URLs for videos (updated content, reorganized, etc) much easier to manage because the code updates with the data change. Lifesaver right there.
It seems appropriate to bookend my summer writing hiatus with some notes on the start of the year on August 6th. I’ve got a lot of things planned and I’m excited to start the year fresh in the same building and same course I was teaching at the end of last year. It’s an opportunity I haven’t had in a while and I’m looking forward to having some direct continuity. I’m also excited because I can take my notes from last year and apply them immediately in context.
These are in a quasi-hierarchy based on how much I’ve thought about it over the summer.
- Every lesson is completely intentional.
- Every assignment is linked back to an observable standard or skill.
- Class procedures will be established early and used consistently to set a culture from day 1.
- Students staying organized is a higher priority.
I’ve also made it a goal of mine to make sure anything I create is reusable and immediately helpful. I’ve learned that I get caught up in how “pretty” something is – big images, clean lines, etc. It’s a distraction and doesn’t necessarily help the learning. To fix it, I’m taking my class website back to bare-bones. Students need information and they don’t want to dig for it. So, my website is now a collapsing tree of links that is so minimal it works on everything. (Turns out, when you don’t care about images, you can build a mobile-ready site in minutes.)


The goal is usability. Titles are descriptive and in sequence. They’re also hidden until the students wants to see it. The arrow icons on some items show that they’ll be taken to another page (usually a Google Doc with more information). This is also lightning fast because the entire website comes in around 10KB right now (compared to an average website, which comes in at 2MB).
There is a lot that will probably change, and that’s okay…teaching is a learning process.
I just finished my fifth year teaching after an 18 month hiatus. I usually jot this stuff down in a notebook, but it’s full, and I haven’t replaced it yet.
Things to remember
- Wanting students to develop organizational skills requires me setting up a framework with which they can learn those skills.
- Even if you use standards-based grading, it’s okay to grade other things.
- Without a pre-defined role for technology, it will be come a barrier.
- Without a feeling of culture, the class will never function as a whole.
This will probably be updated once my brain slows down.
In the silence, a shuffle is a landslide.
Clicks and ticks shake the air.
Furrowed brows rattle individual hairs.
Teaching is a human invention, the same is true for our Assessments.
learning has been around for longer than you or I.
(And you don’t need a test to show you know that.)
We are a culture of inventions, addicted to “data-adds-value.”
We forget that we all used to learn at one time.
We used to know more about the world, but then, schools started.
In the silence, our history slips away.

I think I’m channeling my inner Doyle.
We are all complicit. We are all responsible.
I feel that responsibility weighing down on me more every year.
I want to think smarter.
I don’t want to know more facts or spout more trivia. I don’t want to just work smarter, either. I want to actually think smarter. It’s a much harder goal to accomplish because I’m constantly evaluating not only what I’m doing, but how I’m doing it.
I used to use an app called Any.do to manage a to-do list. Like most productivity apps, it synced across all platforms and I really thought my productivity was going to jump because I would always have access to that list. I would end up ignoring notifications because I had either completed the task or I was being notified during I time when I couldn’t recommit my energy. I was using technology to try and work smarter, but I was actually working harder. I went back to a mix of pen and paper and strategically sending myself text messages, which has worked much better. Because I can now take the time to target – on my calendar – when to be notified to do something, I’m able to work smarter and more effectively.
Working smarter doesn’t always involve an app doing something for us. What really matters is how we can use an app – or a hacked system of tools – to make it easier to work smarter.
In his book Smarter Than You Think, Clive Thompson explores this idea through the development of computer-aided chess. The question is simple: how does chess change when you play with your computer as a resource alongside? The results are interesting and I’ll let you pick up the book to read the whole story, but the short answer is that people played better. Not because they could research every possible solution or find a computer-suggested move with an algorithm, but because they could play more informed. Ideas and hunches could be tested and iterated quickly which would, in turn, inform their final decision. The ability to test ideas and make an informed play is an example of thinking smarter using technology.
The same should be true in education. Technology is exploding in schools and districts, but often with strings attached. Rather than opening the doors to information and pushing students to make smarter decisions about what they’re learning, we’re canning information and delivering it in the traditional way with non-traditional tools. Technology affords us the opportunity to think smarter, but we’re packaging information and removing the thinking process altogether.
To work smarter, you have to be able to articulate why you do what you do the way you do it. What is the goal you’re trying to achieve? Audrey Watters has a fascinating history of the development of the multiple choice test. It boils down to two main reasons: objectivity (presumably) and scalability. Scoring a test is simple: it’s a binary decision – you get each item correct or incorrect. Machines can do the scoring for us, which should help us think smarter because we can free up cognitive processes to analyze results rather than tally. Unfortunately, instruction is rarely informed and the students’ score, rather than a diagnostic, is now a report.
Working smarter means making difficult decisions about the actual practice of teaching and learning. It means gathering information and taking action on that insight. It also means being critical about the technology you’re using to accomplish goals through action. I wanted to be more productive, but the technology I chose to do that wasn’t helpful, so I dropped it for something more effective. Working smarter is working critically and with an open mind, ready to shift if goals aren’t being met.
When you’re working with students, think about the resources available and what goals you’d like to achieve. Just because you can use an app to do something in class doesn’t mean you should. Don’t allow the push to “integrate technology” obfuscate the real reason for being in school – learning to think.
11 days left.
There’s a lot of review happening right now – we’ve finished our final chapter tests and looking ahead at a double-whammy final exam. I’m facing a large bear this year because I wasn’t here first semester, so I don’t have a good idea of what ideas need to revisited more than others. So, I’m assuming we need to touch everything at least once. Tall order, eh?
Review is tedious. Games are fun, but I already wrote about making sure information is more relevant than winning a Dum Dum. Plus, I want to always give opportunities to demonstrate thinking over memorization. If you can think through a problem, you can reason an answer.
Karl had a tweet a few weeks back showing kids finding connections in apartheid South Africa using hexagon cut outs to mind-map the intricacies.
Step 3, #DEEPdt South Africa design task: hexagonal thinking. How are aspects of the problem related. pic.twitter.com/VW4fHqWaMP
—Karl LS (@LS_Karl) May 8, 2015
It looked great and came with high recommendations from Karl, so I tried it out using America’s energy use as our framework. I made small adjustments throughout the day and it went really well in most classes.
Most.
Is the group or the individual more important in teaching? It’s a maddening question and one I’ve wrestled with multiple times already this year.
Most of my hour was spent running from group to group defending myself from, “Is this okay?”-style questions. Another group didn’t even get their pieces cut out. A third got theirs cut about three minutes before the bell rang. I think only one had a really good start at what I was hoping to see in this review activity.
I find myself asking a new, yet similar question: Do the strengths and weaknesses of the group trump the strengths and weaknesses of individuals? Which should I plan for?
“Differentiate!” you may say. “Alas,” say I.
How do you structure an in-depth activity for three or four and a straightforward, rote(?), activity for others? Fairly easily in practice, but that leads to two sets of materials, two sets of directions, and likely multiple sets of rationales about why they get to do something different.
Everything in my teacher brain says that inquiry driven activities are better for long term analysis and retention of information. Much more so than completion on a review worksheet. But, if the environment isn’t conducive to that activity, something has to give.
It’s hard to let go of the ideal in the interest of making it to the finish line.
Review kills me. I struggle with finding a good balance between fun and actual, deep, review of ideas we’ve talked about during class. I also like to make review a little tough to see if they can apply the ideas, not just recall.
I think this original idea came from Crystal Kirch somewhere way back when, but I can’t seem to find the original blog post I think I may have read. Either way, here’s Trashketball.
I split my students into groups of five – it seemed to be the magic number. Threes and fours also worked well. The team could build an uber set of notes, pulling the best from whatever anyone could contribute. They would realize what they had missed over the unit and then add it to theirs as we went, which was nice. The rules are simple:
- Each correct response gets one point for the team.
- Each correct response also gets one shot for bonus points for the team.
- A shot into the Bonus Bucket doubles the point value of the shooting line you choose.
- Each team member must shoot at least once before you begin repeating shooters.
- Winning team gets a Dum Dum from the Bucket of Victors’ Spoils.


It was pretty incredible to see how different teams approached strategy. The incentive to answer questions accurately was high because if you get the question wrong, you can’t shoot for bonus points. You fall behind pretty quickly.
Secondly, some teams took the slow-and-steady approach. For each answer, they took easy, one or two point shots. Their score grew steadily while others took miracle shots, which only saved a team once out of the six games we played during the day. Also, teams didn’t consider the fact that shooting a four-point ball was as easy as hitting the Bonus Bucket from the two point line, which was purposely easy to do.
It’s an easy game to pull off with kids and the more you hype it up, the more fun it is. I took – and missed – plenty of “easy” shots, which broke the ice for those who were apprehensive about shooting a newspaper and tape ball. Others were knocked down a little because those long-range shots are hard to make.
I think, though, this was my favorite review because of the drive to do things well. All teams worked well together to answer questions, and that was important. I know exactly what needs to be discussed again leading into the test later this week. Kids were also attentive – up and moving around – which increased focus and helped everyone review the ideas of the unit.
Bill Fitzgerald is someone you should follow on Twitter if you need help interpreting Terms of Service or Privacy Policies. He pays real close attention to technology use in education, especially new, emerging tech.
Periscope is new and teachers love it. Show the Twitters all the great learning that’s happening in real time??? Definitely sounds like a good idea.
Please, read this.

Click to embiggen.
Privacy is important stuff. You need to pay attention to how you’re sharing information about anyone, including yourself, especially your students.
You can see the whole thread here.
Also, give Bill’s blog a read to dive deeper.
Part two of a post from the other day.
First, head over to the master spreadsheet and make a copy.
What Now?
It's important to note that this works just fine with form responses – you don't have to use the text input I wrote about earlier. You can always go back and add it later. Either way you collect information, we can begin analyzing some of the data.
The whole idea is to have a platform-independent polling system. So, this is built with flexibility and bare-bones functionality in mind. It isn't complex in the way it pulls in student responses, nor is it meant to be. However, there are some tools in place to help you actively identify problem areas.
Setup
An idea I'm borrowing from Andy Schwen is to utilize a central class list. Create a new spreadsheet and fill in student names. I sort mine by last name, first initial. You need the spreadsheet key from this document.
spreadsheet-key
https://docs.google.com/spreadsheets/d/RANDOM-LETTERS-AND-NUMBERS/edit#gid=0
Copy the key and paste it into the cell which asks for it.

Your class list will automatically populate for you. That's all you need to do on this page.
Responses
The Responses tab is meant to be an overview for you. So, if you have a way to extend your desktop across the projector rather than duplicating, you'll have the back-door information.
This page has a response vs. confidence graph that updates as students submit their answers. If you have your class list set (see above), you'll also be able to sort by class period using the dropdown menu. This will import those students and assign an ID number. Students respond with that ID number rather than their name so you can display comments (read on).
If they make a comment, you can also read it and see who asked that particular question or submitted a particularly salty comment.
Finally, you are given an overall confidence (average of all answers) as well as a chart mapping the student's confidence score for each item they choose. It's also broken down by student to aid you in feedback and conversation setting. You could also use this for grouping students on the fly to discuss the question.

Click for full-size image.
Results

This is the page you want to show live to students, and it's meant to go through three steps. At first, the ID boxes at the top are all red. As responses come in, the box will turn green. There isn't any way to prevent someone from submitting the incorrect ID number or a duplicate, so duplicates will turn yellow. You can then follow up individually as needed.
When you click on the “Get Responses” button, a pie graph of all the submitted answers is displayed. This is meant to spur conversation and show the beginnings of a pattern.

Clicking on “Set Answer” allows you to submit the multiple choice answer and change the graph. Rather than the pie chart, it shows the confidence score and the number of each answer submitted. Again, this can lead to conversations with your class about how confidence can correlate with making the right selection.

Clicking “Reset Form” clears all the responses from the form, resets the charts, and clears the Responses tab of data so you can ask another question.
This isn't meant to collect persistent data – it's meant for flexibility and high-level insight. Hopefully, it's helpful to you. Please leave comments on this post (also linked from the template) with bugs, functionality improvement requests, or other feedback. This is definitely a pet project, but I'll try my best to maintain it as it gets used.
Continuing on my data collection and analysis streak, I’ve got a little project to throw out into the wild and see what happens.
Student response systems are expensive and can be clunky. Google Forms are taking over the role of the stand-alone response system because of their flexibility in the wild during collection (device agnostic) and during analysis.
I like using forms, but they don’t work so well when students don’t have access to an Internet-ready device. So, I came up with a way to allow students (or anyone, really) to respond to a poll using either a form input or a text message.
The challenging part of this is getting the message into the spreadsheet. I have a Google Voice number, so I looked into Apps Scripts for Voice. Unfortunately, there is no way to access Voice using Google Scripts. There is an API for Hangouts, but it’s not documented very well and doesn’t look like it would even work with Apps Scripts or Spreadsheets. Maybe I’ll head back down that road someday, but not right now.
I decided to go with IFTTT, which has some benefits (easy to set up and manage) and drawbacks (only checks every 15 minutes-ish, so you need to manually run it during a session). It’s clunky and adds a breakpoint in the flow, but it works.
The Setup
You need to start by making a Google Form. For this, I want to allow students to send in four things: Their name, a multiple choice answer, a confidence rating, and any comments. Create the form with your collection in mind.
| In IFTTT, you have to tell the script which cells to populate in the sheet with three straight bars, “ |
|
|
”. Knowing your form setup is really important before you make the IFTTT recipe because it’ll save you a headache later. My recipe puts the responses into the first three columns and then I use a Google Apps Script to break them into the correct columns. |
The Flow
Method 1 – Pure Google Forms
The audience opens the Form and answers the question displayed live. They hit submit.
Easy.
Method 2 – Text Message to IFTTT
First, in Voice, you set up email notifications for text messages. Then, in Gmail, set up a filter to catch the emails and do two things: add a label (I used “text”) and then mark it as “read” (mostly for your inbox-zero sanity). Now, have the audience send a text to your Google Voice number (see below for formatting).
In IFTTT, set up a trigger which uses Gmail -> Google Drive. The Gmail trigger should do a search for your new Gmail label. When it finds that email, it appends a row to your form input spreadsheet.

More complicated, but now we have a way to get raw text data into the spreadsheet. Now, you need to make sure the text message is formatted correctly.
Splitting the text
Google forms split fields into their own columns. You can’t do that with a text because IFTTT puts the whole message into one cell. To split it, you need a way for a script to find the individual components. For this, I have participants do the following:
Name [comma] MC answer [comma] Confidence (1-4) [comma] comments
IFTTT dumps this into a placeholder cell in the spreadsheet and it can now be broken up at each comma using the following script:
splitsms
function splitCells(from) {
var sheet = SpreadsheetApp.getActiveSpreadsheet().getSheets()[0];
var colC = sheet.getRange(2, 3, sheet.getLastRow()).getValues();
for(var i=0; i< colC.length; i++){
if(colC[i][0] != ''){
sheet.getRange(2+i,4).setValue('=if(istext(C2:C),split(C2:C,",",true),"")')
}
}
}
After running this script, you now have all the responses in the correct column and you can play with the data more and look for patterns in the responses.
*So, there’s the start of the idea. I have a second sheet going, but I’ll write that up in a subsequent post. If you’d like to try this yourself and you’re having trouble reading my rambles, here’s the tl;dr version:
- Get a Google Voice number.
- Turn on email notices when you receive a text message.
- In Gmail, set a filter for your email notifications.
- Sign into IFTTT and copy this recipe.
- In the spreadsheet, copy and paste the Google Apps Script above, which splits the text message rows into columns, into the script editor. You may need to refresh the sheet to have the menu added to run the script.
I’ll follow this up with the data analysis sheet explanation.
Continuing on my data-trends this week, I’ve realized (consciously, at least) that when quantitative data is shown to students, it’s a report of some kind: a report card, a progress report, test scores, etc. It’s all final information – it isn’t actionable.
Yesterday, we played a review game where students submitted answers to a Google form which then spit out a grade based on those submissions. The purpose was to get them thinking about the information and to give them some immediate feedback – as a class – on how they did.

Seeing the gauges along with their place against all reported classes helped visualize where they fell on a preparedness scale in context.
It also helped the class see what specific standards they needed to go back and look over. I didn’t want individual information for this activity because the goal was generalize, actionable information.
Michael Pershan prompted my thinking this morning with his video (and comments) entitled, “Why Our Hints Don’t Help.” It’s extremely insightful (go take a look) and really helped me think through how I talk about quantitative information. It should be a call to action, not just a report.
It also changes the way students see these scores. They aren’t final any more – it’s a spot check on their progress. It’s a reality check for their perception of how well they have learned the information. It also leads to more good questions like, “Where can we find more information on [X]?” It’s a visual prompt, more than anything, which helps set the course for subsequent learning.
I tried something new today with my students – I asked them to rate their confidence in their answers on a 1 (total guess) to 4 (definitely know I know it) scale. I collected the aggregate information for each class and started flagging issues.
First, this only took me about 5 minutes to do. So, after we finished the questions, they started working on their review for our test this week. I pulled in the numbers, ran a formula or two, and had the percent correct for each item as well as the average confidence. Then, we started talking about what they noticed.
Some noticed right away that a few questions were more missed than others. Someone also noticed that questions with a high percent correct tended to have a high confidence rating. The same was true for lower-scoring questions. I then pointed out what I was really interested in:
Discrepancy.
I saw nods and furrowed brows as I pointed out low-scoring questions with high confidence ratings. It doesn’t compute. If so many people got it wrong, why were we so sure it was right?
This highlights areas I need to go back and review again, which is really nice. It also helps students reach a metacognitive place on their own work – it was only 6 questions, so they know what they got right and wrong.
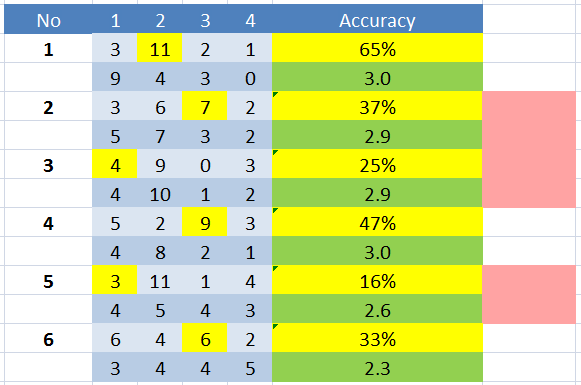
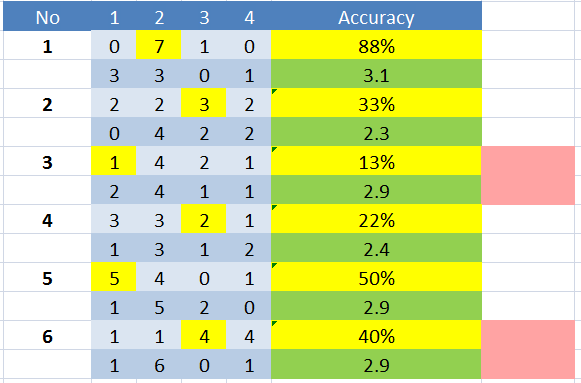
Different classes, different priorities.
And then here’s the aggregate data for all classes:
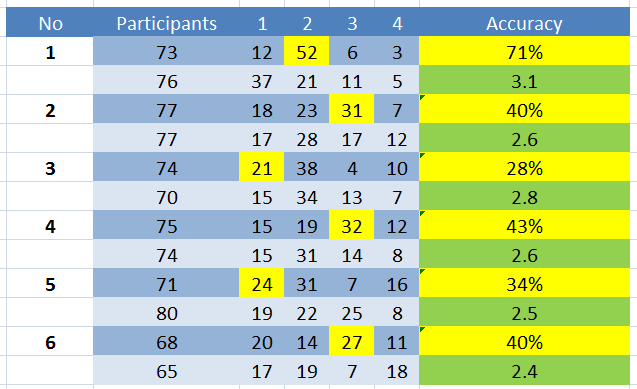
For now, I’m adding the red flags myself based on an arbitrary percentage and confidence level discrepancy. I’m doing that because I don’t know of any other way to make that comparison. So, here’s the question:
Are there statistical analyses that can be done on two-variable data (correct vs. confidence) which can then highlight areas significantly lower than expected?
I even went so far as to perform a correlation test on the data, which shows a definite positive correlation between the score and student confidence:
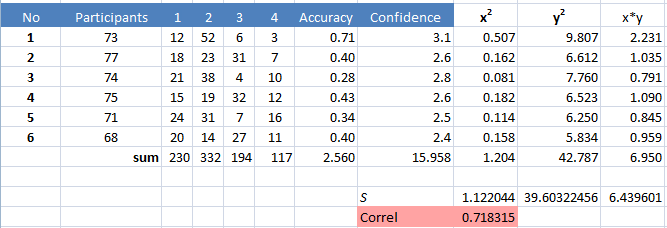
But again, I don’t know how to set up that discrepancy benchmark statistically. I may be thinking too hard about this, but I’d really like to have more to go on than, “This one is low compared to confidence.” It’s also a very small sample, and I know most correlation tests (t-Test, ANOVA, etc) require 10 samples, usually, so I’m not putting a ton of weight on the stats.
If you have any experience in this kind of analysis, I’d appreciate some pointers in the comments.
I meant to grab a bag of stuff for school this morning on my way out the door. Turns out at 5:45 in the morning, you don’t remember to grab things off the counter (thankfully, I don’t need that stuff until tomorrow). I don’t like to-do list apps (prefer pen and paper), and my phone is on silent each morning until I get to school.
I hate notifications anyways, which is why I turned everything off other than phone calls and text messages. I still get calendar reminders (out of absolute necessity) but even then, I tend to close those without thinking too much about actually remembering to do something.
Texts, though, are a different story. I pay attention to them. When someone sends a text, it has my attention.
So, rather than rely on a to-do list or plain calendar reminders to do something, I’m routing those through IFTTT to send myself a text.
To do this, log into IFTTT and create a new recipe using Google Calendar as the trigger. In step 2, be sure to choose “Event from search starts” as the trigger. Otherwise, any time you add an event, you’re going to get a text message, which isn’t cool.

Then, pick a keyword – I used “reminder” – to search for. It has to be in the title or the event description to fire correctly. So, for me, my calendar event would be: “Reminder – get groceries.” Then, set the time to when you actually want to do whatever it is you need to do. Again, mine is around dinner tonight because I’ll be near the kitchen and can do it quickly.
Set the SMS channel as the action (make sure your phone number is correct!) and heypresto, you have a SMS-enabled text reminder system for those little things you tend to forget.
Again, I know that this can be done just using the calendar notifications. But, if you’re like me, and hate those, you can use this instead. Also remember this works with any phone, not just smartphones. So, if you revert (like I’ve also considered) you can have the benefits of notifications when and where you need them on any platform.
I took the time the other day to show my students what exactly I look at when I’m grading tests. I use standards based grading, so I’m going way deeper than just the number right divided by the number wrong. I don’t even put tests into the gradebook, really. They’re each broken down into the standards contained within and they’re reported individually.
This is really hard for students to understand. So, I showed them the data I look at when scoring their tests.
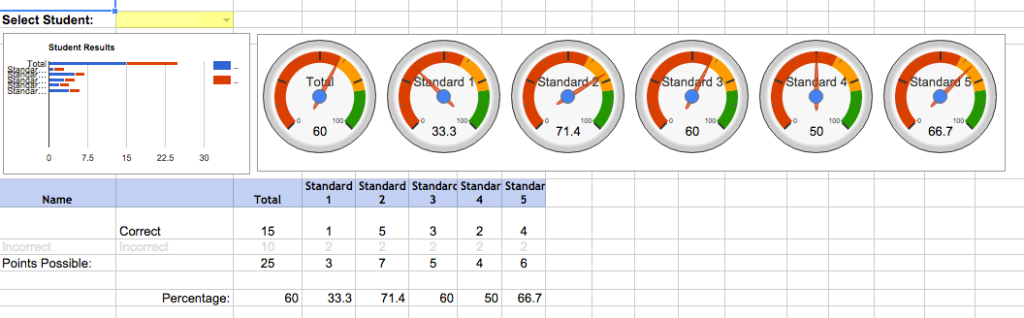 Individual student report
Each student has a report generated (name obfuscated here). Questions on the test are broken down by standard, and I’m shown a quick, high-level gauge of where they stand on this assessment. This is not the only information I take into account when assessing their skills, but a look through this lens can be helpful. I can also see (further down the page) which questions they get wrong and compare those with the item analysis screen.
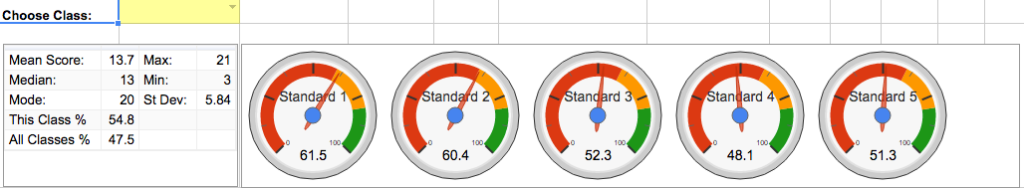 Individual class report
I can also take a high-level look at each class. Mean score and deviations are given for the entire assessment, and each standard is broken down again based on the aggregate. This view is especially helpful for remediation and follow-up to the test. Some classes get more attention to one standard, others get different priorities. It’s really helped me make more effective decisions when planning following an exam. This page also has individual student scores broken out by standard down below the gauges.
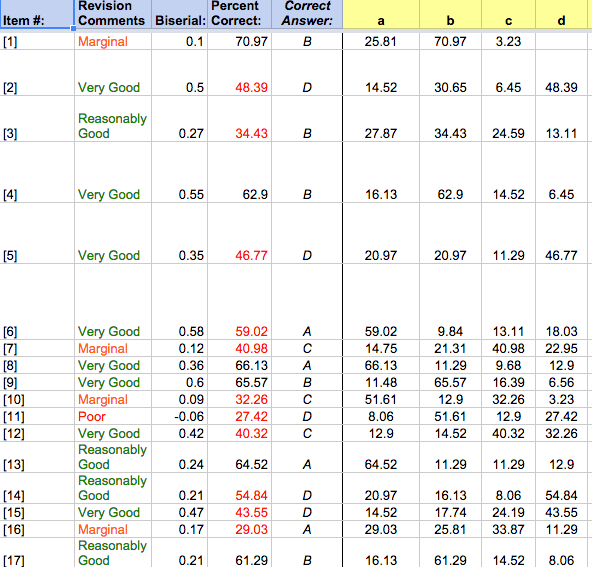 Item analysis
Finally, the item analysis. This helps bring it all together. Again, I see the high-level information for each question, and it helps me pinpoint which items need the most attention. I can then cross-reference those with each individual class and even down to the individual student to see which standard they struggle with the most.
So yeah, I showed this to my students.
And they were surprised that I put so much thought into it. I also think it helped them see the fact that everything we do in class is two things: related to the standards and for their benefit.
I don’t give tests because they’re fun (ok, well, the analysis can be fun…) or because they’re super effective. They can help me make informed decisions which, in turn, help them in the long run.
I don’t think they’d ever seen information used in this way in such an honest and straightforward manner. Many of them actually expressed that I was putting myself through too much with these tests, which means I must’ve gotten through something…
Either way, if you’re collecting information, make sure it’s used productively. Also consider taking it up a notch and plainly showing what you do with that information just so they know.
**Update 12.22.2016** Since this has become quite a popular script, I’ve converted it into a Google Docs Add On so it can be used across documents. Check out [the blog post](http://blog.ohheybrian.com/2016/12/introducing-endnote-generator-add-on/) or the [Endnote Generator website](http://dev.ohheybrian.com/endnotes) for more information.
**Update 8.27.2016** As Phil noted in the comments, the script didn’t format anything over two digits in length. That has been [corrected in the source](https://github.com/bennettscience/footToEnd). If you need more (100+ endnotes may be too many, though…) leave a comment and I’ll go back and make the changes.
Krissy Venosdale asked on Tuesday if there was a way to make endnotes in Google Docs as easily as footnotes. I thought, “Surely there is.”
Well, there’s not.
So I wrote a script that does it.
It’s hosted on GitHub along with instructions on how to install the script (it’s not an add-on…just a custom script) and run it in your document.
Here’s a peek:

When you add the script to the document (manual process right now – read the instructions) it adds a custom menu from which you run the script.
I know endnotes and footnotes aren’t really used in high school, but if you’re writing a book or something…maybe it’ll be helpful to you.
Either way, it was fun to write and it works pretty quickly. I haven’t tested it with documents more than a few pages long, so if you’re going to try it on something major, I’d suggest making a duplicate copy to run it on first, just in case.
I’m a teacher by day, after all.
