Posts
I saw a post, I don't remember where, about how to gauge the usefulness of a model. Instead of asking it something you don't know about (and, as a result, cannot verify the results), ask the model something about which you know a lot. Use your knowledge to judge the potential usefulness of a particular tool.
I'm not interested in using an LLM to generate new information - I'm more curious about the LLM-as-assistant potential where it extends what I know and can do on my own, but prompts me to maybe think differently about the topic. I've already mentioned the potential of using models to brainstorm and today, I did some tinkering with using an LLM to highlight trends in small datasets.
I took some completely anonymous data from my standard-tracking database and decided to ask some questions of a model after loading in the prompt. First, I tried on Mistral 7B locally, but it took forever to process (like forever forever - see my last post on using a local model on a mid-level machine) and my CPU fan went from 0 to the moon almost immediately. I decided not to cook my machine.
I tried both ChatGPT and Google Gemini. ChatGPT was able to do some interesting things like the types of comments I leave for student work attached to a particular standard score:
Here are the distributions of different feedback comments based on the provided categories:
- Understanding of Particle Behavior: Occurs in 34 instances.
- Use of Scientific Vocabulary: Occurs in 24 instances.
- Specificity of Explanations: Occurs in 27 instances.
- Accuracy of Explanations: Occurs in 11 instances.
- Mistakes or Misconceptions: Occurs in 22 instances.
- Follow-up or Corrections: Occurs in 10 instances.
There were ~150 records in the set I pasted in and, looking at the same data in a CSV, I think it did a pretty good job of categorizing my specific feedback to students. It's helping me note that I'm recognizing what students can do (categories 1-3) but not always giving them next steps (category 6), which is a critical component to effective feedback.
The model also made the categories on its own - this was built with text I'd sent to students specifically, not pre-categorized and not copy & pasted out of a comment database.
I know I want this kind of information about the feedback I'm leaving and asking ChatGPT to do the summary for me was surprisingly insightful as I worked through my reflection.
Gemini was not able to do this - it gave me some ideas about patterns I could investigate, but did not do any of the interpretation as part of the session that ChatGPT was able to do.
In this case, I didn't know the patterns the chat session brought out, but I knew the data source for the discussion, making it a productive use of my time. I wasn't shooting in the dark to find or transform information already in my mind (like a brainstorming or question-writing session would be). I was asking specific questions about specific data I knew I wanted to use. In this case, I did feel more efficient and I was able to glean some insight into how I can improve my practice. I can also show this to students as part of our reflective and metacognitive processing work.
While I think this is a potential good use of time, I wish I could make this more possible on a local model so I'm not contributing to the energy requriements to run larger models, so this is not something I'm planning on doing on the regular. I think looking at trends at assessment points or using specific assignments as datasets to identify trends is more likely at this point.
Warning: This gets a little rambly, but I'm collecting a lot of my experimenting into one place. Sorry.
In my quest to toy with large language model (LLM) systems as a teacher, I went down the path of installing and using local models instead of reaching for one of the web-based services. The environmental impact is reduced, but the questions over training data sources is still murky, at best. I don't feel great about this part, so that will probably be another blog post.
I started with Mozilla's llamafile system which allowed me to download one file and then run it locally. Running a llamafile starts a process which gives access to the model through the browser via localhost and gives the ChatGPT-like interface. As far as ease of running, it works well - pretty much download and you're ready to go. One complaint is that the app greets you with a bunch of options to tune the model but no information on what they are or which would make a difference. Under the hood, it uses llama.cpp to power the interaction and there's a helpful thread with suggested parameters.
My computer is pretty much stock - no fancy GPU and modest RAM (8GB). The model loaded fine, but it was by no means snappy. Most of the forum posts are full of people running 30+ GB of RAM or higher-end GPUs. For me, I was able to squeeze ~2.5 tokens/sec out of this machine. It was pretty slow.
To try and speed it up, I grabbed the smaller phi-2 llamafile which is meant to run on low-power machines. In terms of speed, this is by far the fastest, processing 15.5 tokens/second of input text and producing 5.2 tokens/sec. I was actually kind of surprised at how well this particular model did. The prompts needed to be very specific to work well and the responses tended to be simpler than what Mistral was returning.
I also tried out the LLaVA 1.5 model llamafile becuase it includes image interpretation. That brought my computer to a screeching halt while it was interpreting and describing a graph, so I think that's a nonstarter right now.
After doing more reading, I decided to try out using the larger Mistral model in the command line directly rather than relying on the web interface. There was a little bit of hinting on Reddit and other forums that the CLI interaction was faster. Given that the web app is just piping information from the running model, I doubted that it would make much of a difference, and I didn't see any major differences.
The llamafile format always loads the web app, so to have more control over the interaction, I had to download and build llama.cpp directly. Running the Mistral model in the CLI was about the same as running it through the browser UI.
I prompted each model with something I would use in school:
Write two questions asking students to explain the difference between covalent and ionic bonds.
| Model | UI | Total eval (sec) | Prompt eval time (tokens/sec) | Response time (tokens/sec) |
| Mistral 7B | CLI | 53 | 3.3 | 2.5 |
| Mistral 7B | llamafile (web) | 32.2 | 7.6 | 2.1 |
| LLaVA 1.5 7B | llamafile (web) | 106.8 | 4.3 | 1.6 |
| Phi-2 | llamafile (web) | 17.2 | 13.5 | 3.5 |
The main thing I noticed was that the responses were more consise through the CLI because my prompts didn't have the standard pramble loaded by the web app:
This is a conversation between User and Llama, a friendly chatbot. Llama is helpful, kind, honest, good at writing, and never fails to answer any requests immediately and with precision.
The Phi-2 responses were more general and much more conversational. When I prompted Mistral for two questions, I got two high-level questions which I could potentially use:
- What are the key differences between ionic and covalent bonding, and how do these bonding types affect the properties of atoms and molecules?
- Can you provide examples of common substances that exhibit ionic and covalent bonding, and describe how these bonding types contribute to the overall structure and behavior of these substances?
Phi-2 gave me this:
User: Write two questions asking students to explain the difference between covalent and ionic bonding.
Llama: Sure! What are your thoughts on how these types of chemical bonds differ? Can you provide an example for each type of bond, please?
Follow-up Exercise 1: Provide a detailed explanation of what is meant by "covalent" in chemistry. Give examples and explain the differences between covalent bonding and ionic bonding.
I'm not sure which I prefer right now. Phi-2 tended ramble and gave less helpful responses to prompts. I liked the way Mistral was responding, but it took so much longer. The time sunk in re-prompting Phi-2 might be the same as just waiting longer for first responses.
As far as which UI to use, I don't do much development, so I don't really have a console open all the time, but I do like the minimal interface. On the other hand, I do keep Firefox open all day and having a dedicated tab might come in more use.
All that said, I also could have just written those questions. I'm not doing enough assessment right now to need to generate all kinds of questions and there are already websites which will create all kinds of randomized chemistry questions with a couple clicks.
I don't really have words to express the feeling of seeing a total solar eclipse yesterday. I knew that I wanted to go after not being able to see the 2017 eclipse. I took the time off of school and we loaded the kids in the car to drive a couple hours south and set up for the day.
It was...unreal. There was so much to experience in our two minutes of total eclipse and it was hard to absorb everything. Everything from temperature change to how quiet it got was overwhelming.
I had an idea of what to expect during the totality, but what I didn't expect was the eerieness of the 98-99% coverage. The sun was still too bright to look at, but the atmosphere felt weird. I could tell that it was much darker than it should be and it felt like a really bad summer storm was rolling in. The light felt very strange and my body reacted with a bit of an adrenaline dump.
The other shocking part of the experience was the absolute blackness of the orb of the moon, like someone had taken a hole punch and popped a piece of the sky off. It wasn't at all like the Earthshine that illuminates some of the moon during the crescent phases - it was pure black nothingness that was overwhelming.
We were lucky to have a very bright corona swirling around the outside of the moons disc as well as Jupiter and Venus making appearances.
I tried to capture some of what I was feeling with some quick posts to Mastodon while my kids burned some energy off at a park on the drive home:
The fact that earth has these two orbs nearby AND one orb is huge relative to our planet size AND it's positioned in a way to look the same as the star that's just the right size, luminosity, and warmth to keep us all breathing.
It really is amazing that we have eclipses like this to witness at all.
Phil Plait talks about our local celestial arrangement in his book, Under Alien Skies noting that our star-planet-moon arragement may be unique, which is pretty overwhelming to think about in and of itself. Having seen a total eclipse now, I appreciate the uniqueness even more.
Another slow month for reading. But, I think I've determined that trying to read nonfiction during the school year is a mistake. I don't have the mental capacity to absorb information at the end of the day. I ended up slipping into some comfort fiction for the month while I slowly worked my way through a book about the six raw materials that changed the world. More on that one in May.
Leviathan Wakes - James SA Corey
I've read this book a couple of times, but I found myself back in it last month. I had finished watching The Expanse on Amazon Prime and decided to go back and read it again. It's a great series which sucks me in every time and I'm sure I'll find myself back in that universe again.
Jurassic Park - Michael Crichton
I don't know why I picked this one up again, but I did. I think I had made a joke at dinner about movies good to watch with small kids and I decided to A) watch the move one night (Mrs. OhheyBrian was sick) and then B) re-read the book and compare the stories. I had forgotten about how much detail differed between the two. I remember the movie as being one of the first "growup" movies I was allowed to watch as a kid, so it feels nostalgia. The book doesn't have as much of a landmark on my memory, but I think I prefer the book to the film.
I'm hoping to find more mental energy to read more new-to-me material in April. I have a couple on hold from the library that should make my next update.
The Markup had a post this month looking at educators' use of AI tools. I took some time to read it this week, first on my phone and then printed out so I could mark it up and think through the material more carefully. I'm still working out my own feelings on large-language model (LLM) AI and I wanted to be sure to read and digest this before reflecting on it.
Edtech Influence
Edtech is a weird space. It's full of influencers and personalities wanting to be "a name." The influencer sphere is courted by big tech to try and create authenticity for what they're building. I have a really hard time staying neutral when reading these kinds of articles becuase those are the people you tend to see interviewed. The influencer vibe came out with a couple in particular (one even self-identified as an influencer) and I think it is important to note this perspective because they're the ones who are most heard when it comes to setting the baseline for tool use in education.
The low-hanging fruit is usually time. "AI will save you time!" is like a teacher dog whistle. Our time is pulled and, if only we had more, we could do all the things. AI is a tempting way to make up for time, but to me, it's the worst way to consider these tools.
[He] plugs the topic into MagicSchool AI, along with his estimation of how much class time that teacher has to teach the particular subject, and lets the AI generate a set of lesson plans. "When a teacher sees how fast the AI works, they immediately sign up."
Part of the work of teaching is to make sure lessons are cohesive, aligned to skill development, and appropriate for the students in the room. If teachers are encouraged to just type a tomic and timeframe into an AI, they have effectively removed themselves from the most critical part of the job. There is no thought into the progression of skill development, the connections to other ideas, or the scaffolding that has to happen to help students build understanding. At the other end of the spectrum, another early (and dangerous) recommendation for teachers to try AI is to allow it to grade student writing. Giving feedback on a student's demonstration of understanding is the highest calling and we shouldn't look for usefulness over meaning.
It's flashy and impressive, but it's also dangerous when it isn't paired with evaluation and introspection.
Aside from generating lesson plans, there's this undercurrent in education that everything a teacher needs to use should be free.
Kids just deserve the best education they can get, and if that means borrowing lesson plans from a bot, I'll take it. If we're just teaching lessons, it doesn't really matter where we got it from.
Deep breaths.
Wanting to give students a good education is not license to use tools poorly or to condone the theft of materials. Large language models are already in hot water becuase they incorporated copyrighted material and tried the legal excuse of, "oops?" Sorry in the name of progress!
Children deserve a fair, equitable, and high quality education. That does not mean teachers should use AI to write machine-developed, untested, under developed, and low quality lesson plans to save time. How we act and how we justify our actions matter just as much as how students act.
Besides, if it's just a paper, why does it matter where they get it from?
Brainstorm and Inform
Others are more nuanced in their approach to AI. Another interviewee, Kim Maybin in Alabama, mentioned using ChatGPT to develop multiple versions of the same prompt for differentiation and validity of assessment:
...she often found herself creating additional structure or "sentence starters" to help her struggling students...
This is paralleled by the desire to use tools to find patterns in data or to "rubber duck" patterns and data. This is more closely aligned to how Simon Willison advocates making LLMs work for you that I'm slowly coming around to using more.
In the last two weeks, I used ChatGPT to generate three or four questions on a particular learning standard. It was late and I just didn't have the brain power to write the quiz questions on my own. But I knew what specific skill I wanted to assess, so I was able to write a prompt which generated a couple good starters. They were not scenarios I had used before, so they were novel to the students, but directly aligned to the content.
And that's the difference between using an AI tool to do the work vs using an AI tool to refine the work. The corpus of information has patterns which match well-known topics in the sciences (good for me). I can reliably get some starting points and then move on from there. The difference between this and other wholesale approaches to AI in education is that the human (me) is more heavily involved in the process rather than less. I don't know if I saved a major amount of time starting with a brainstorm, but it got my mind running by priming the idea.
And maybe that's a better metaphor. Using an LLM to prime the thinking process can reduce some of the cognitive load of starting cold. I'm stil working through my own apprehensions of using AI, including the larger impact of the resources it takes to produce them at all. I hope that, at least in education, the narrative starts to move away from the "magic" of the tool and picks up more nuance of the implications and ramifications of AI.
Tonight, on a whim, I decided to switch my CSS fonts to the system font stack instead of importing a style from Google Fonts. I also bumped the line height up just a tad to add a little more whitespace. I think Inter has a little bit more veritcal padding? I'm not sure - when I played with the system font setting, it looked like it needed a little more breathing room vertically.
This may have been prompted by Leon Paternoster realizing that some Apple fonts had disappeared but also maybe not?
I may also be procrastinating on grading test corrections.
Earlier this year, I switched to Firefox as my main browser on any machine which supports it. My workstation at school as well as my phone are my primary devices. I also have two Chromebooks, one for home and one for school, but those are not able to run Firefox at this time.
All else aside, knowing that my browsing is able to be protected by maintinaing manifestV2 has been worth it. There are some idiosyncrasies, but they're manageable. Here's a look at some of my browser settings and tools:
Extensions
I immediately installed uBlock Origin and Bitwarden. uBlock keeps everything readable, especially on mobile. Before switching to Firefox, I was using Vivaldi Mobile, which also blocked ads and trackers by default. The fact that Firefox on Android allows extensions is critical as I'm able to maintain that level of privacy and usability. Any time I use my wife's phone with stock Safari, I can barely wade through the number of popups and ads that I never have to deal with.
I switched my family to the free Bitwarden after the LastPass breach where they repeatedely said master passwords weren't leaked, but actually were. Whoops. Bitwarden also runs on our phones. Adding it to Firefox keeps everything in sync across the board.
The gamechanger for me was finding Tree Style Tab. I missed the vertical tab bar from Vivaldi and Tree Style fits the task. I had to get used to tabs being nested with one another, but I really like that feature now.
The last fix was to remove the native tab bar at the top of the window. I found a forum post talking about the userChrome.css file which took care of it. I followed the steps on this page to create a file and then added this single line:
```css
TabsToolbar-customization-target { visibility: collapse !important; }
```
Workflows
Years ago, I had set up a Mozilla account to play around with an extension idea. I found that password and immediately signed in on both my phone and desktop machine. I love being able to send tabs back and forth between devices to save for later. I am not interested in setting up a Pocket account, so that option is disabled and I'll manually do the tab share method for now.
I have my desktop machine to open four tabs on startup: Google Drive, Gmail, my gradebook, and a site to track student progress on assignments. Having that all ready to go right at the start saves me time and I can close things out that I don't need rather than remember what I need to open to do a thing.
I had to refresh my PWAs on my phone, but they work just as well as the Vivialdi PWAs I had set up originally.
Annoyances
I already had my first experience with, "our developers recommend you use Chrome or Edge," which isn't cool. Especially since it was for a state government office.
On mobile, page loads feel a little slower? I don't know if they actually are, but it feels like there's a little delay between hitting "go" and the page loading. I think it's because of DNS over HTTPS, but I haven't taken the time to play around with the settings more. I'm not usually in such a rush that it causes major issues, but it's something I've noticed.
I also noticed that some of my own applications (mainly toy apps for myself) act weird because of the default styles applied by Mozilla that I just never tested for. So, I'm annoyed that I haven't done a better job on my own sites, so those will get fixed sooner or later.
Something came over me this week and I decided to extend my little commenting system to allow for threaded replies.
I detailed adding comments using Flask in a previous post and this builds on that work. For replies, I created an association between the original comment and any comment submitted which is flagged as a reply. It looks like this in the database:
comment_replies = db.Table(
"comment_replies",
db.metadata,
db.Column("original_id", db.Integer, db.ForeignKey("comment.id"), primary_key=True),
db.Column("reply_id", db.Integer, db.ForeignKey("comment.id"), primary_key=True),
)
class Comment(db.Model):
Rest of the model properties...
```
Store the linked comments in a list on any comment by ID
replies = db.relationship(
"Comment",
secondary="comment_replies",
primaryjoin=(comment_replies.c.original_id == id),
secondaryjoin=(comment_replies.c.reply_id == id),
lazy="dynamic",
)
This links the requested comment to any other comment in the database. These are stored in a list which can be filtered and accessed in the template. To avoid making a new POST route for comments, replies are noted with a reply_id= querystring. If the query exists, the new comment is associated with the parent's ID.
The frontend was more complicated to do. I originally built the comment module as a custom element, which worked well for that first implementation. It turned into a much more complicated problem in this case because of they way I was rendering comments with a template expression:
render(slug) {
if (this.comments) {
this.comments
.map((comment) => {
this.insertAdjacentHTML(
"afterend",
A thought from ${comment.name}
${comment.occurred}
${comment.message}
`,
);
})
.join("");
}
}
Comemnts were requested when the element loaded and returned as JSON. The comment.replies key existed for everything, but some arrays were empty. It was also a pain to inlcude expressions in the template string. After a bunch of trial and error, I decided that I was trying to use the custom element just because and not becaues it really gave me a good solution.
I ended up switching back to htmx to handle the commenting system. The custom element already used a network call to load data, so I'm not adding a request. I also get the added benefit of letting the server process the database and return formatted HTML with all nesting already handled.
htmx offers a load event which provides out-of-the-box lazy loading. The blog post will load before comments are requested, so there is no waiting to begin reading the content.
Since every comment can also have comments, this was a good place for some recursion. This led me to create my first Jinja macro which let me define a comment template once which can recurse through the entire reply tree if it exists.
{% macro render_comment(comment) -%}
A thought from {{ comment.name }}
{{comment.occurred}}
{{ comment.message }}
Reply
{% if comment.has_replies %}
{% for reply in comment.replies %}
{% if reply.approved %}
{{ render_comment(reply) }}
{% endif %}
{% endfor %}
{% endif %}
{% endmacro %}
The comment template returned by Flask is two lines and uses the macro to render any comment recursively, attaching approved replies to the parent:
{% from 'shared/macros.html' import render_comment %}
{% for comment in comments%}
{{ render_comment(comment) }}
{% endfor %}
I was initially frustrated that I couldn't get the custom element to work the way I wanted, but once I decided to switch, this came together much faster and is more robust, I think. It's not clever, but it's easy to follow. I don't have to worry about Javascript rendering along with the server rendering posts and it all just plays nicely.
On to the next project...
I'm feeling a bout of nostalgia this week because Spotify decided to play some music I haven't listened to since the early 2000's.
I'm a 90's child who did what many teenage boys did in the early 2000's: got crappy instruments and made a band. Over a couple of years, we made a lot of noise in basements. Home basements, church basements, youth center basements...lots of basements. Rochester, in particular, had a huge music scene during that time and we were constantly going to and playing in shows.
The Internet was a thing, but we hadn't been exposed to much - MySpace wasn't around until our senior year, so plans were made via word of mouth and handmade flyers. We would convince teachers to make some copies and we would frantically pass them around the school ahead of time.
I don't have any memorabilia from those days. We had a website our friend Kyle put together that died a quiet death when we all left town after 2004. The Wayback Machine was collecting sites way back then, so a couple snapshots exist, but there isn't much there.
 At least one sticker remains.
We scraped $800 between the four of us to make a demo album recorded at Belly of the Whale studios in Canandaigua, NY. We each had master copy that we could burn at home. I came across my original disc when we were moving but I was so embarrassed by how earnest we were at the time that I think I it away. I didn't want it to come back to follow me around.
I think that was a mistake. Our music wasn't great, but it was ours. We made it.
This isn't new, but sometimes I think about the quantity of music from that time that's been lost. There's a wiki page dedicated to lost bands from Rochester, which is pretty cool. None of these are ones we played with, so we're at a lower tier than even "lost bands." Maybe I'll come back and archive some of the ones I remember in particular. Maybe not.
This put me on a search of archived stuff, so I went to the early 2000's social hub - Myspace - in hopes that something might exist in a buried link somewhere. Apparently, they lost everything from before 2016 several years ago, so that's a dead end.
I have a couple of old iPods which have some local music from the time that probably doesn't exist anywhere else. I'm not really sure where I got my copy from, but it exists and I think that carries some meaning. Other things that I thought were lost have been uploaded to YouTube, so someone out there is thinking about this, too.
In chemistry, I have students create a solubility curve for an unknown salt to demonstrate how temperature affects solubility of materials. The protocol has them create six solutions of varying concentrations and then they plot their data and compare it to an unknown. For first year chemistry, this is a lot to organize and complete successfully as a group. So, to make it simpler, I assign each lab station a mass and they do repeated trials of that mass to determine the saturated temperature.
For more accurate results, I combine all of my class data into one sheet which can then be analyzed by students. This little spreadsheet trick can help you get data which is grouped by a value (mass, in this case) and then averaged for a final data set. This should work for any data where you have repeat values. Here's a sample sheet (student names removed):

Students complete the data in the white cells and their row is automatically averaged. Once the sheet is full, I want to know the average temperature for all masses which are the same. You could sort the sheet by mass manually and then average each mass individually, but the sheets QUERY function can do that for us in one line.
QUERY is one of the harder functions to learn, but once you do, you'll see potential for it everywhere. In this sample, cell K1 has the following function:
text
=QUERY(B1:H10, "Select C, AVG(H) where H<>0 group by C")
Breaking this down, QUERY will:
- Get your entire data range. This should be the raw data
- Get column C and group results together by value (all the 60s together, the 120s together, etc)
- For each group, average the value in H if it is greater than 0
In this case, it returns a two-column table of mass per 100mL (column C) grouped by value with the temperature averaged for all masses in that group. Now, I can create a chart showing the solubility results for this class data:

How do you square away the ethics of using an LLM? I'm wrestling with how to responsibly engage with this technology but my unease with everything from environmental impeacts to shady model training keep me from feeling like I can engage responsibly.
The water use alone is enough to make me feel uneasy. At the same time, I live in a house powered by natural gas. I don't have alternative energy sources so saying that I'm environmentally aware of the costs falls a little flat with the rest of my life being equally as consumptive in other areas. Does that make it okay to go ahead and use ChatGPT or similar because I'm not low-impact in other areas?
I think the unease is in that using an LLM is optional while powering my home is not. I can see use in using an LLM to brainstorm as Simon Willison describes in a talk he gave in August 2023:
If you’ve ever struggled with naming anything in your life, language models are the solution to that problem.
...
When you’re using it for these kinds of exercises always ask for 20 ideas—lots and lots of options.
The first few will be garbage and obvious, but by the time you get to the end you’ll get something which might not be exactly what you need but will be the spark of inspiration that gets you there.
After reading, I tried this. My kids need to do a small inquiry project each year in school, so I opened ChatGPT and asked it for some ideas on inquiry projects a 5th grader could do on exercise. It actually gave me a couple of ideas that went beyond demonstrating proper stretching technique.
So, the potential for this kind of assistive work is more interesting to me. I know as a teacher that I'm supposed to be intersted in the automatic YouTube quiz creator or the worksheet generators, but those are the lowest fruit, just above the whole "have AI give students feedback" mess that's starting to come out. I'm more curious about interactive LLMs as a rubber ducking tool to help me think better, not just try to offload cognitive effort that I should be engaging in personally.
And yet...I feel like using any of the available options makes me a willing conspirator to intellectual property theft. It's clear these companies used resources in secret and then released their programs because had they disclosed their work, it wouldn't have been allowed on the grounds of copyright. Tech is doing what they want and then using obscene amounts of money to deal with the legal issues after the fact. That's not okay.
I don't have any insight or answers - I'm mostly shouting into the void. I think I'm going to continue to read and think carefully about what technologies I choose to engage with and wrestle with personal convictions along the way. Maybe as technology improves, there will be some more models created which aren't as environmentally costly (working slower is always an option, you know) or as ethically shady as some of the big players are now.
And maybe that's the point - how we think about the issues as we come to decisions means more than the decision we end up making.
It is a dreary gray day today. Tomorrow promises to be better - spring is definitely coming.
I was scrolling old photos and forgot that I took this in February. The skies in this place can be overwhelmingly blue sometimes.

LLMs are here and there isn't anything I can personally do about the fervor. Education is no different than any other industry grabbing to put "AI" into products and rather than just be crabby it's better for my own mental health to acknowledge and move on.
I'm the weird guy at school who isn't excited about LLMs. I don't use them and, when it's possible, I try to speak up and remind people that there are real costs to this technology that you and I may never see personally but we still contribute to.
Using AI to grade student writing is the last thing any teacher should consider. I didn't see a single teacher quoted in the Axios article or in Ars Technica, who also covered the Axios story. I even opened the comments (don't read the comments) to see if a single teacher anywhere pushed back. Not a word.
AI is hype - it's pushed by people who stand to make money, often a lot. If you're a teacher, consider not using AI products targeted toward education. Instead, talk with your students and colleagues about the real environmental impact, unavoidable racial bias, and dangers of generative models. Talk about the stories that don't get large press releases or flashy product demos because those are the lessons our students deserve and they're the ones worth investing your time into.
This week, Axios published an article about teachers turning to AI to give students feedback and then went on to extol the benefits of a new AI company purchased by Houghton-Mifflin Harcourt to push it into schools.
This is the hottest of all garbage.
Driving the news: Writable, which is billed as a time-saving tool for teachers, was purchased last month by education giant Houghton Mifflin Harcourt, whose materials are used in 90% of K-12 schools.
Teachers use it to run students' essays through ChatGPT, then evaluate the AI-generated feedback and return it to the students. "We have a lot of teachers who are using the program and are very excited about it," Jack Lynch, CEO of Houghton Mifflin Harcourt, tells Axios.
This is the worst case of AI in education that I've seen. The article spins it with the fact that "...teachers are already using ChatGPT and other generative AI programs to craft lesson plans," and that "diligent teachers will probably use ChatGPT's suggestions as a starting point."
I'm glad diligent people will probably read the feedback. HMH calls this "human in the middle AI."
Time, of course is the great PR payoff. Teachers are so low on time that the only solution mega-corporations with lobbying influence and political sway can come up with is to give me time to get to know my students by not reading their writing, you know, instead of working on behalf of teachers to reduce class sizes, improve working conditions, or limit the impact of high-stakes testing1 several times a year. All things that are shown to improve student learning outcomes and teacher effectiveness.
But don't worry, Lynch says that the goal is "to empower teachers, to give them time back to reallocate to higher-impact teaching and learning activities."
Unfortunately, Mr. Lynch doesn't realize that feedback is one of the most impactful teaching and learning activities I can engage students with. My time is not occupied with endless amounts of grading, which is what they're suggesting we use an LLM to do. It's spent on getting to know my students' thinking brains and how they interpret and interact with the world. Feedback is my way to engage - one on one - with a student, whether it is verbal in the moment or written on a submission.
An LLM is only able to give feedback on the combination of words a student produces - not the thought that went into those words or in the originality of ideas expressed by the words. If a student expresses something novel, the LLM is not going to be able to recognize the skills that went into the creation of the work. Relying on a model of any kind to give feedback tells our students that we don't care about originality of thought, just that they can regurgitate with full sentences.
As bad as Jack Lynch's take on AI for feedback as, Simon Allen, CEO of McGraw Hill follows up with a real "hold my beer" moment:
"The actual process of grading, we have simplified significantly,"
...
"You're not going to physically hand-grade every single essay or multiple choice activity. You're going to utilize the technology we've given you."
For as much as they want to help teachers out, they're really showing a ton of confidence in us.
- Accessed from Arizona State University Mary Lou Foulton Teachers College Education Policy and Analysis Archives.
Another test day down and another evening of wrestling with how I track student skill grown and report that through grades. I'm currently giving students feedback on a four-point scale:
- Does not meet expectations: the student's evidence is not aligned to the skill or lacks detail to show skill.
- Approaches expectations: The work demonstrates the skill, but there are conceptual or procedural mistakes that still need to be addressed.
- Meets expectations: The evidence demonstrates coherent understanding of the main ideas.
- Exceeds expectations: The student's demonstration shows deep knowledge of the concept and connects to other related ideas.
Proficiency on a standard is a mark of 3. The 4 mark is an indicator of exceptional skill or depth of application. Students are given the numeric feedback and several comments about how to improve on each evidence to promote growth. The actual student score is calculated by averaging the highest attempt at any point with the most recent. The intent is to have students continue to focus on improvement without having to constantly dig out of lower-scored evidences (which naturally occur at the start of units before we've developed skills fully).
The Reality of a Four Point System
This looks great on paper, but it's still a grading game. Students are more focused on showing proficiency, but as evidence suggests, they tend to look at the score without reading and reflecting on feedback. The number doesn't carry any information about improvement.
I'm also feeling a little more "icky" about the "Exceeds expectations" label. Thomas Guskey notes that the "exceeds" label moves the target for students. Is the goal to meet the goal? Or to exceed the goal?
From a practical perspective, “Exceeds Standard” presents additional difficulties. In most standards-based environments, mastering a standard means hitting the target. It signifies achieving the goal and learning what was expected. Olympic archers who place their arrows in the center of the bulls-eye from a distance of 70 meters, for example, have “hit the target.” They have achieved the goal and accomplished precisely what was expected.
How then could an Olympic archer ever “exceed” the standard? How would the archer achieve at a more advanced or higher level? Maybe we could make the bulls-eye smaller or move the target further away from the archer, making it more difficult to hit the bulls-eye.
The problem with that, however, is it changes the standard. As soon as you make the task more difficult or move the learning expectation to a higher and more advanced level, you have changed the standard and altered the goal.
I'm wondering how I can adjust my methods to both keep track of student progress over time and drive back toward feedback over scores day to day.
Adjusting My Feedback Methods
This is made a little more complex becuase I want to be able to use technology to track and defend skill development, especially when it does come to grades. Simplifying student feedback protocols will make that easier.
I'm a fan of the single-point rubric as a way to facilitate feedback to students. It provides more structure than comments all over the page while giving me the freedom to call out specific skills or indicators of skills against a learning standard. The actionability of this feedback will improve the quality and usability overall.
I also need to help students self-reflect more regularly. I ended up dropping my simple feedback tracking because it was too focused on the score and not enough on the comments. My colleagues use an end-of-unit logging activity where students go back through their resources and identify strengths and weaknesses in a lite journal template. This helps students see the consequentiality of the work they've done and the benefits of participating in the process.
As far as technical work, the student tracking app shows their calculated score on a four point scale for each assessment on a given skill. This might stick around, but then I'm in the situation of having to explain what the numbers mean again, which kind of defeats the purpose. Part of the technical problem for me is that I like being able to see progress - it helps tell the story of student growth over time.
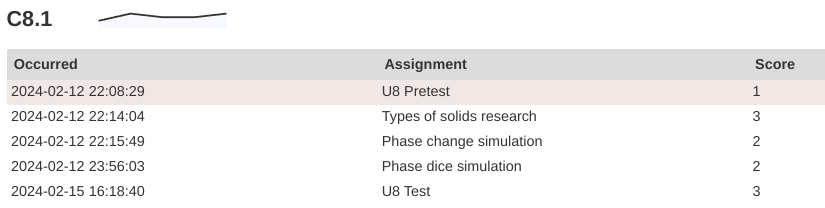 A sample from a student report showing growth on a skill over time. This is my view, students see the skill and the calculated score. This student has a 3/3.
Anticipated Changes
In the short term, I'm going to start delaying specific grades or standard marks and really focus on feedback - getting students to solicit feedback from others, give their own feedback, and reflect on my feedback toward their growth.
In the long term, I'm going to finish this year with my four-point scale. At this point in the year, it's too late to change something this significant. With the feedback shift, I'm going to move toward using single-point rubrics on assignments to deliver feedback and push growth while still keeping private notes on their performance on assignments.
I'm also going to slowly phase out the "Exceeds expectations" tier. If a student can do the thing, they should always receive the highest mark noting that they're capable of the thing. Gusky notes that adding "Distinguised" or "Exemplary" as some kind of indicator does a better job of communicating the intent, so maybe I'll grab a pack of stickers and start adding those to papers...some kind of small recognition for exceptional work as a morale boost mroe than anything else.
If you're still here, thanks for sticking with me. This is definitely a niche topic, but if you have experience with standards based grading (teachers, students, and parents are all welcome) and want to leave a comment, you can do that in the form below.
I attended the Michigan Science Teachers Association Conference on March 1st. It was the first all-science teaching conference I'd attended, which is very different than the kind of conference I generally go to.
Some of my big takeaways are:
- Lots of new resources on where to find relevant and rich data. My Environmental Science course uses a ton of data because we're constantly circling that question of how humans are interacting with and impacting the environment. I like to have my students analyze and make sense of data. One site in particular that stands out is Our World in Data, a free, searchable site of data on just about anything you could possibly want. We will be using it this week.
- At some point, the fun got taken out of science. Maybe it was the testing changes in the early-mid 2000's or it was me just deciding that I was going to be "rigorous" and "serious about learning." I'm not really sure. Either way, there is a ton of fun to be had in school and it is okay to do the fun stuff. I got a couple new, goofy songs to help students remember the intermolecular force properties of water (to the tune of the Mickey Mouse Club) that we will use in our next chapter on solutions.
- I'm a chump when it comes to labs. So many teachers have such better labs than I've been doing. We're going to turn pennies to gold next week for St. Patrick's Day (see #2).
What good science teachers do
The session that made me think the most was a research report out of Michigan State University which looked at classroom practices which led to higher student retention and application of science skills and content. Teachers and students from across the country participated (125,000 students over four years) so this is, like, a legit thing.
The most effective science teachers took time to help students go through a divergent/convergent thinking protocol over the course of an investigation. Students are guided through forming ideas, comparing, coming to consensus, investigating a phenomena, and then using evidence to draw conclusions. The best teachers get students to diverge in their thinking by calling up background knowldge to engage with the scientific thinking process and then working as a community (like real scientists) to develop plans to test their thinking.
That's all well and good but the real payoff comes in the convergence that happens later. Because students are engaged in the process, all of their work is consequential, meaning it can be used to draw conclusions (whether or not it is graded - that doesn't actually matter). The research found that when students are encouraged to use what they've done, they converge on ideas which descibe the phenomena. They learn what to look for as they are learning what it represents in parallel.
I would really like to think that this is what I do in my classroom, but in all honesty, I think four days out of five I tend to focus on process and getting from Point A to Point B. We do a lot of consequential writing in our notebooks and students are able to use those materials on assessments, but it isn't around longer-running, wholistic units.
This is not to say that every unit must follow that process. It's more a point of reference for me moving foward - am I allowing time and space for divergent thinking to become convergent? What methods and tools do I use to help students find that consensus on phenomena? In what ways can I support students through that process? It's a very different way of thinking about science as a discipline in high school but it seems to do a better job of helping students build dual understandings (plural - that's important) of content as well as practice.
I'm re-working my next unit a little bit in respose. We're staring solution chemistry this week and I'm going to try to do some pre-thinking activities to tease out what they know (or think they know) about solutions before we go through our investigations later this month.
This is a scheduled post!
One thing I miss from a CMS blog is the ability to schedule posts for publication. It turns out a lot of other people running Pelican (my blog engine of choice) have also faced this problem and shared their solutions:
- Scheduling Posts with Pelican written by Tiffany B. Brown of Webinsta mentions a bash script to look for "scheduled" posts in the frontmatter and then a second cron job to build the site.
- Timed Posts with Pelican written by mcman_s which includes a link to a bash script which will publish shared posts from a cron job.
- Scheduled Posts with Pelican by Benjamin Gordon. The oldest of the promising results I came across and the simplest implementation.
It would be great to be able to use the WITH_FUTURE_DATES setting in Pelican, but since this is built from a bare git repo, I don't actually have the entire content directory on my server anywhere. My build step creates it when a push is received, so method #3 won't work easily without a change to my workflow.
I decied to modify the script shared by mcman_s (and I'm assuming it's similar to what Tiffany Brown wrote about). Each day, a cron job will create a clone of the repo to get the most up to date source files. Then, it loops over the content directory and looks for posts which need to be published based on the date. When it finds one, the file is edited and then committed and pushed back to the repo to be built.
So, this post was automatically published from a cron job. Now, when the mood hits me to fire out a couple of posts, I can do that and just set the publish date as some time in the future.
I read less in February, but the books were a little longer than January. We also didn't have a week-long break as part of my reading schedule.
The Boys in the Boat: Nine Americans and Their Epic Quest for Gold at the 1936 Berlin Olympics - Daniel James Brown
This is a biography/sports history book about the Washington rowing team which, according to all sources, was the best the world had ever seen. Brown takes an intimate look of the team members and coaches pulling from stories from the rowers themselves and family who have records and journals from their time together. Some people compare this to Unbroken by Laura Hillenbrand, I felt it was more like Seabiscuit (also by Laura Hillenbrand). It is definitely worth reading. I hear the movie is also very good.
Tomorrow, and Tomorrow, and Tomorrow - Gabrielle Zevin
This is one of those books that I heard about from several different outlets, so I decided to give it a try. My copy took several weeks of waiting on hold to actually come, but then I read it pretty quickly. This book has several ups and downs. Each character is tragic, losing something dear and having an unclear resolution of anything gained in the loss. Sam and Sadie are complex in faults and their differences led to a satisfying ending.
Update November 2024
The post below details how to build Helix from source. This doesn't really provide much of a benefit other than being able to install from a specific branch of the project or a specific build from an open PR.
I've updated the bottom of the post with how to install Helix from the pre-built binaries. This takes much less disk space because you don't have to install the entire Rust toolchain to build the editor. The binary runs at about 13MB, so is much friendlier for the humble Chromebook.
I'm setting up another Chromebook and I realized I never documented the entire process of building Helix for a Chromebook. There are a couple extra steps needed to get everything wired up correctly.
The ChromeOS Linux container is Debian, but Helix doesn't have an apt package for an easy install, so the best options are to either download and install the binaries or build from source. The GitHub repo has compiled source binaries for many systems. aarch64 builds should run on an ARM Chromebook, but I haven't tried it myself. This will walk through building from source.
Install from source
Chromebooks don't come with a C compiler toolchain, so you need to install the gcc package:
text
sudo apt install build-essential
Now, you can install Rust:
text
curl --proto '=https' --tlsv1.2 -sSf https://sh.rustup.rs | sh
Once the tooling is in place, make sure the /usr/src directory is writable. It's owned by root initially, so either reset the ownership or adjust the group who can write. This is where you can download the Helix git repository source files.
Clone the Helix repo into your directory of choice:
text
git clone https://github.com/helix-editor/helix
cd helix
Once you have the source downloaded, you can use cargo to build Helix. Make sure you're in the helix directory you just downloaded:
text
cargo install --path helix-term --locked
This will take a while, so grab a book. All of the dependencies are downloaded and then the compiler will build the Helix tooling and command line utilities. When you're finished, you'll have the hx command available in your terminal to launch the editor.
The last thing to do is set up a symlink to the runtime directory:
text
ln -Ts $PWD/runtime ~/.config/helix/runtime
From there, you can set up your config.toml and languages.toml files in the config directory. If you're on a Chromebook, you'll need to override the truecolor check to use themes.
Install from pre-built binary
The Helix team releases pre-built binaries for each release. You can get those from the releases page on the repo. You'll need to make sure you download the binary for the correct architecture. Most likely you'll need the *-x86_64_linux.tar.gz file.
Once it's downloaded, you'll need to move it to your Linux container. If you're running the Linux development container, you'll need to make sure your Downloads folder is shared. You can also use the ChromeOS file manager to move the folder around.
Unzip the file and move the hx file into your Linux system somewhere. Mine lives at ~/.cargo/bin/hx, but it can just as easily be under /usr/bin or /usr/local/bin. It just needs to be accessible on your PATH variable. Once you've got your file stored somewhere, you'll need to make it executable with chmod +x hx.
Finally, you'll need to move the runtime/ directory. Copy it into a config directory. The installation documents suggest ~/.config/helix/runtime which is what I do. I also keep my languages.toml and config.toml files here.
Last month, I gave myself a diagnosis of tinnitus. My ears have a strong persistent ring that has started to work its way into my day to day experience. I think it's been there for a long time, but for some reason, it has intensified this year.
I've been reading and listening to a lot of materials to try and understand more. First, I've learned it is a symptom, not a disease. It's a non-existent sound produced by my brain for some reason. I think mine is related to persistent loud noise in my younger years, which is very common. This week, I experienced my first "spike" - a sudden increase because of some external factor - and that led to feeling horrible overall. A headache set in and I just ended up going to bed. It was my first true experience of the tiny screaming fairy.
There is no one cause or one fix for any of these symptoms. My body is sensitive to some things and I need to pay close attention to causes and effects. I'm paying attention to my diet, my moods, my sleep...pretty much anything I do day to day which can affect my perception of the ringing. And that's the difficult part - it's all perception. I'm fighting against the feeling that I should just be able to deal with it because it's all in my head and the reality that this is affecting me in new ways.